How do we separate the wheat from the chaff?
- Stock markets have set records for several years in a row. Just this January, for example, the S&P 500 index (large US companies), the Russell 2000 index (small US companies), Japan’s Nikkei 225, the Stoxx Europe 600 and the FTSE-100 index all scaled new highs.
- But the recent years’ rally was ‘narrow’, led by a minority of companies in sectors such as AI, banking and defence. As a result, the 10 largest companies made up an unprecedented 37% of the MSCI World Index at the end of 2025.
Now, in the past few months, share prices have taken a different turn. Prices have struggled to hang on to their recent highs in many markets – especially in US shares and in the technology sector.
- Secondly, the stock market’s best-performing and worst-performing sectors of 2025 have traded places or ‘rotated’. Firms in communications and technology, especially software, led the market in 2025 but have weakened, so far, in 2026. By contrast, the energy sector and materials/chemicals firms have been the best performers in the first six weeks of the year.
Figure 1: Two years of the S&P 500 index by sector
| 2025 (calendar year) | 2026 (year to 16 February 2026) | |
| 1 | Communication services: + 34% | Energy: +21% |
| 2 | Information technology: +24% | Materials: +17% |
| 3 | Industrials: +19% | Consumer staples: +16% |
| 4 | Utilities: +16% | Industrials: +12% |
| 5 | Financials: +15% | Utilities: +9% |
| 6 | Health care: +15% | Real estate: +8% |
| 7 | Materials: +11% | Health care: +2% |
| 8 | Energy: + 9% | Communication services: –2% |
| 9 | Consumer discretionary: + 6% | Information technology: –5% |
| 10 | Consumer staples: +4% | Consumer discretionary: –5% |
| 11 | Real estate: +3% | Financials: –6% |
Source: Standard & Poor’s, data taken 16 February 2026.
Quality shares have performed well during this ‘rotation’
Many CCLA clients are charities, endowments, and churches, or other investors who take a long-term view of their investments. That’s why we apply a quality tilt to our investments. Definitions of ‘quality shares’ vary but tend towards shares with steady profit growth, strong cash flows returns and low debt. In other words, shares that are less susceptible to the ups and downs of economic cycles.
Quality, as an investment strategy, has lagged the broader stock market in 2024 and 2025. But in the long term, as we’ve previously described, quality shares have outperformed broader markets.
A few months ago, we provided a top-down overview of how quality shares perform as a category versus, e.g., growth shares1. Now we want to show you a bottom-up view, of individual quality shares in our funds. We broadly distinguish three categories:
- Many shares in CCLA’s funds continue to deliver on their quality credentials
In the long run, share prices mainly rise because companies increase their profits (or ‘earnings’). In that vein, many of the quality shares in our funds have performed well in recent years, because company earnings have risen. Examples in the ‘new’ economy and in more traditional sectors include:
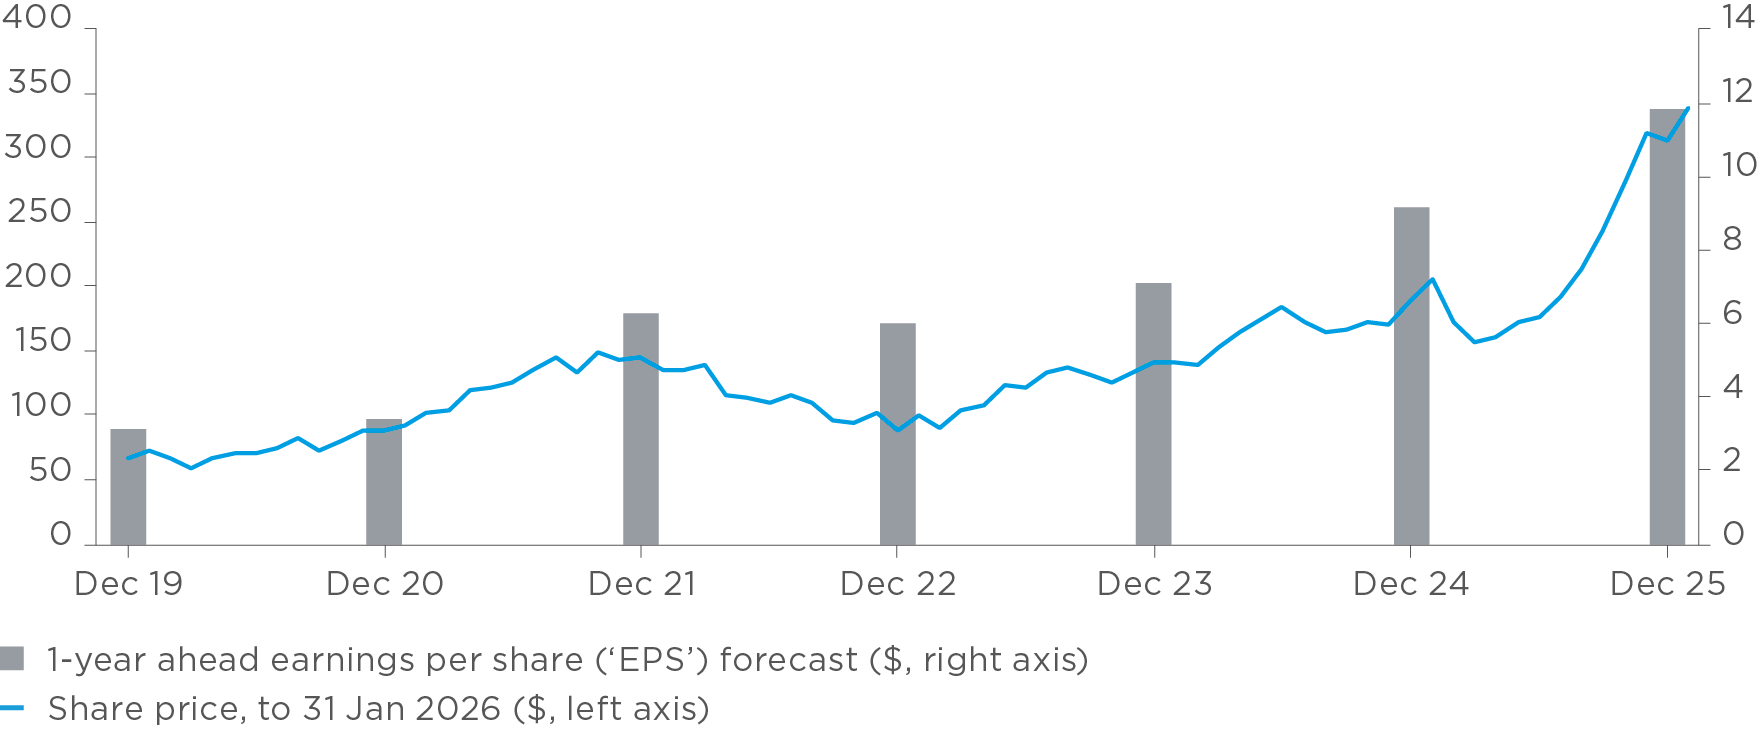
Google Parent Alphabet
Source: Bloomberg.
- Alphabet’s share price rose 65% in 2025, as concerns over fines receded and the company’s AI offering (Gemini) looked increasingly strong.
- Alphabet has nearly tripled its earnings per share (EPS) since 2019. Financial analysts forecast it to grow its EPS by 29% in 2026.
- Alphabet’s expenditure on AI infrastructure is significant but, in many analysts’ views, the company increasingly looks like it will be one of the winners of the AI race.
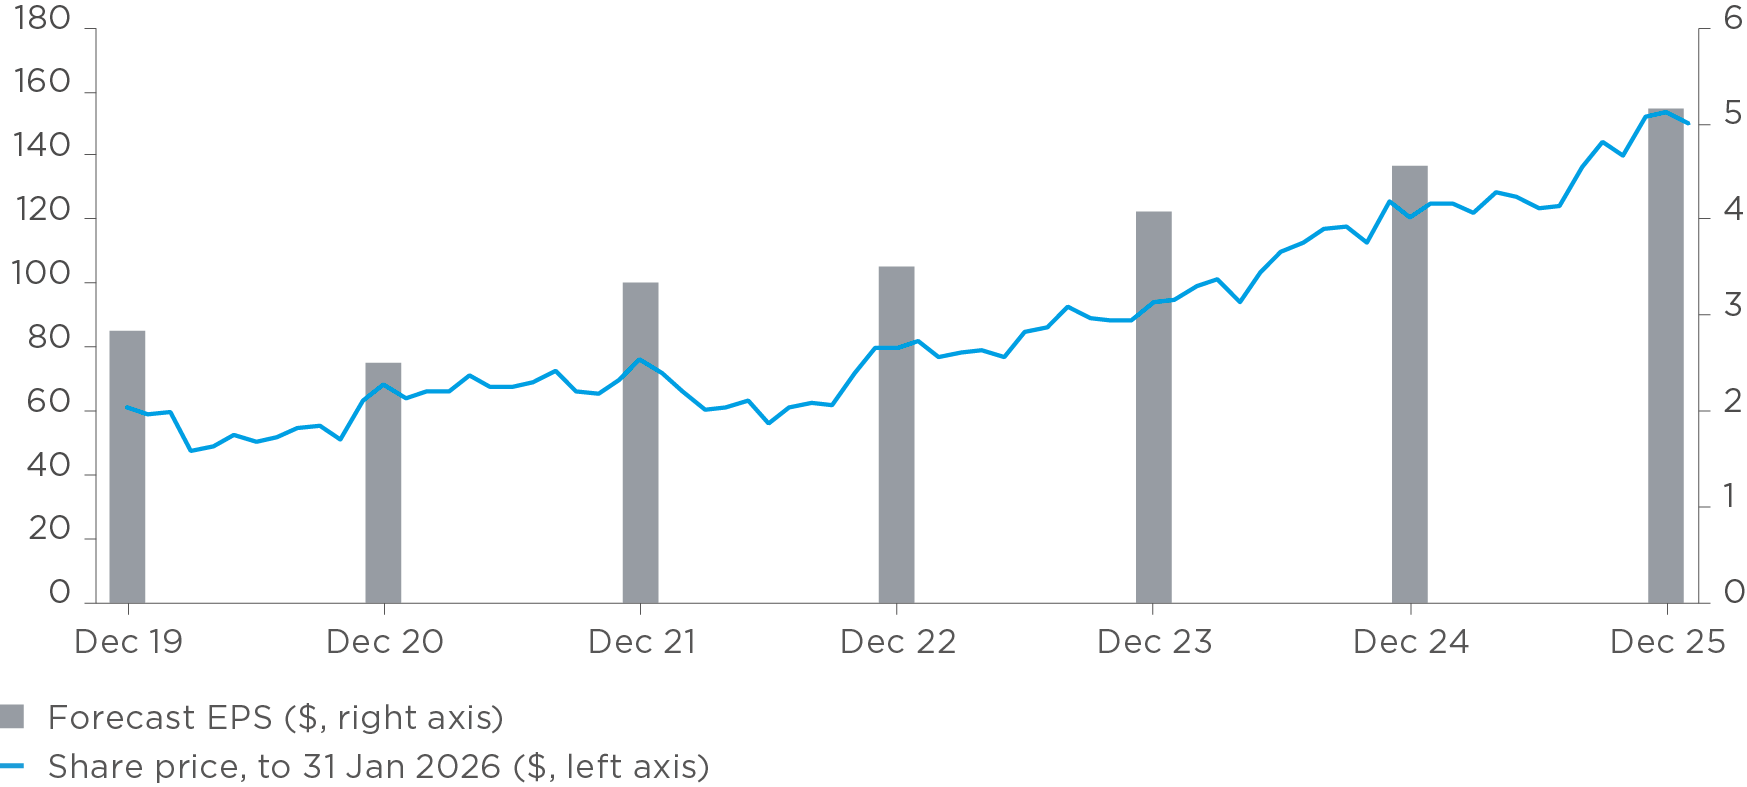
Discount retailer TJX
Source: Bloomberg.
- In the UK, TJX is best known as the owner of TK Maxx. The company’s share price rose 27% in 2025, as consumer demand for discount apparel and home goods outpaced the broader retail market.
- TJX has increased its EPS more than 80% since 2019. Financial analysts forecast the company to increase its EPS by 13% in 2026.
- TJX’s share price has strengthened in recent years, as the company’s strategy for sourcing brand-name goods at discount prices benefits from excess inventory at struggling department stores. In addition, the company aims to increase its global footprint from c. 5,000 stores now to c. 7,000 stores over the next 15 years, including by entering new markets like Spain.
- Where companies’ fundamentals have deteriorated, we have reduced our positions in their shares or sold our positions altogether
Examples of shares whose fundamentals deteriorated in 2025 include UnitedHealth and Adobe:
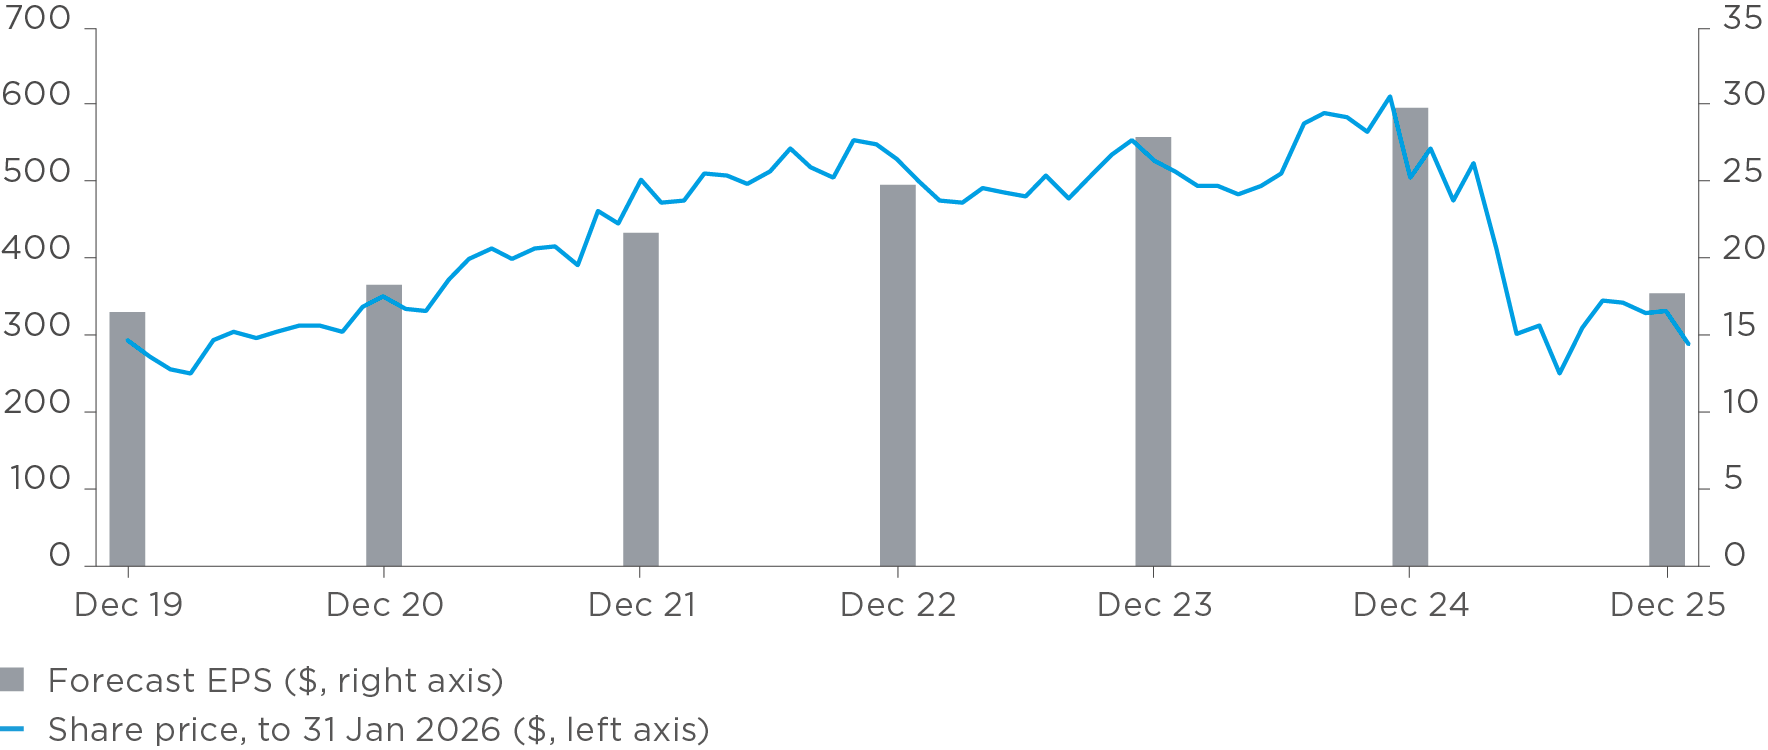
American health insurer UnitedHealth
Source: Bloomberg.
- UnitedHealth’s share price stalled in 2024, and fell 35% in 2025. We sold our position in January 2025, more than doubling our investment, before the company’s steep share price fall. Our analysis at that time highlighted fundamental concerns over US government health care funding, tighter regulation and rising costs.
- The company’s EPS forecast rose in 2024, but fell by 40% in 2025, mainly because the company itself guided expectations much lower, from c. $30 per share to c. $18 per share.
- UnitedHealth’s share price rebounded somewhat in late 2025, as investors concerned about an ‘AI bubble’ turned to other sectors. But in January 2026, the company forecast its first fall in revenues for over a decade, and its share price continued to fall.
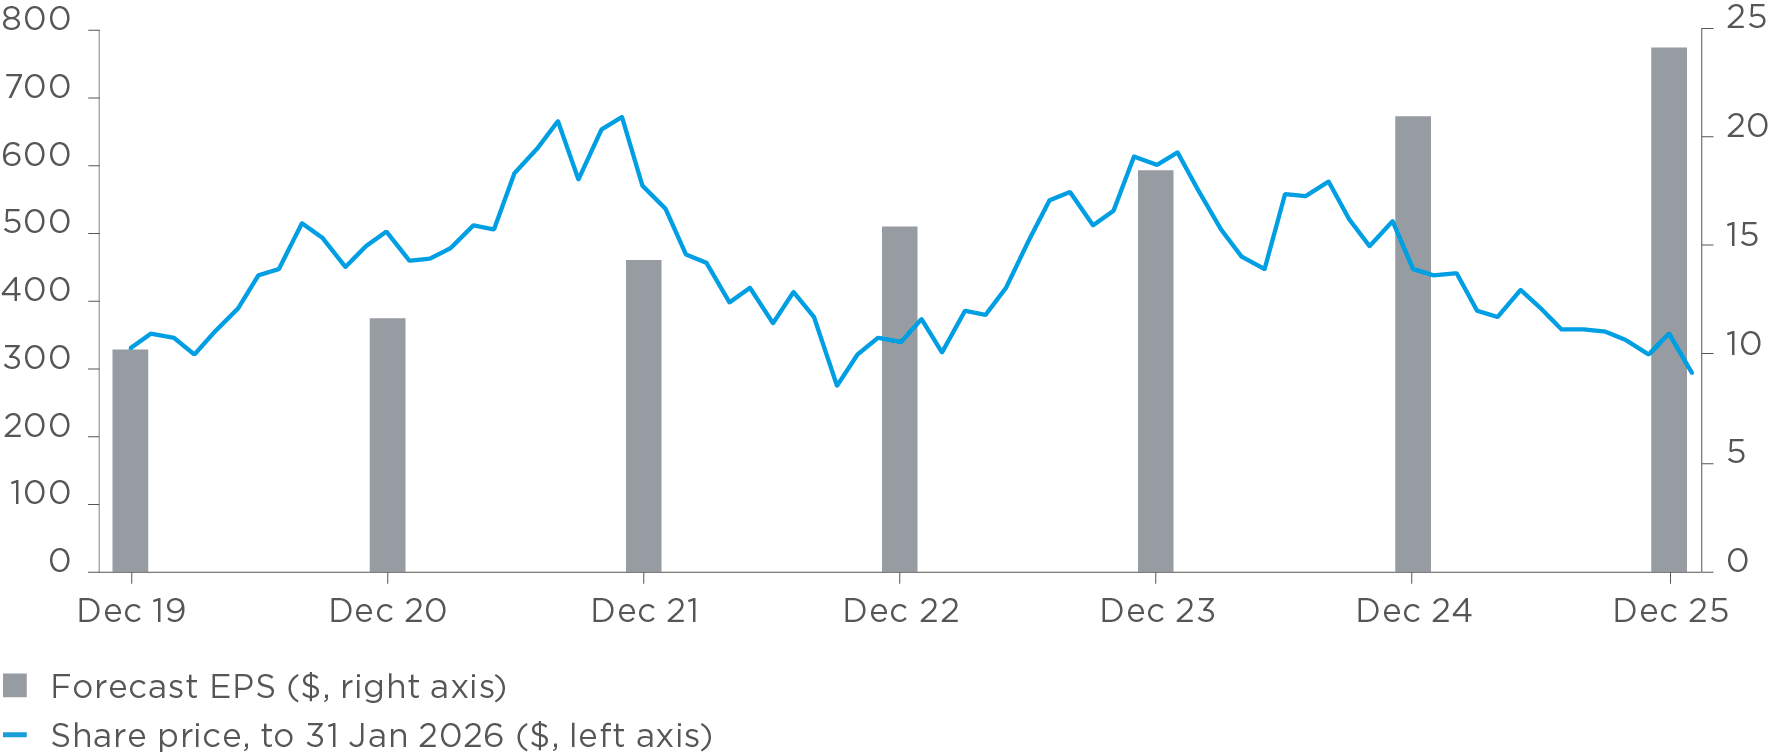
American software company Adobe
Source: Bloomberg.
- Adobe’s share price fell 25% over 2024, but analysts’ forecasts of its EPS continued to rise. Nevertheless, the company’s share price continued to fall, by 21% in 2025.
- Importantly, our fundamental view of Adobe changed in the course of 2025: our analysis made clear that AI was likely to impact Adobe’s competitive position. As a result, we took profit by selling this position in early 2025.
- Adobe’s share price fell another 16% in January 2026. It remains our view that AI will threaten Adobe’s growth, and that Adobe’s products will not be able to continue to command its premium subscription prices.
- Some shares in our funds have underperformed, even though their fundamentals have strengthened. Because their fundamentals remain strong, we continue to hold these positions
The poor performance of some quality shares, in 2025 and early 2026, mainly came from three sources:
- First, the valuation multiples of these quality shares (e.g. their price/earnings ratios) started 2026 at high levels, but have fallen since then.
- Where this fall in valuation happened because these companies’ fundamental investment cases worsened, we reduced our exposure or exited these positions altogether.
- But where, in our analysis, these companies’ investment cases remain strong, we have taken advantage of their share price falls to add to our positions at lower prices.
- Economic growth in the consumer and industrial sectors (apart from AI) weakened somewhat over 2025, and it has continued to be weak in early 2026. In our analysis, however, the underlying US, UK and eurozone economies are showing signs of improvement.
- Finally – and especially in early 2026 – investors have become increasingly concerned about AI’s potential to disrupt existing businesses, especially in software.
- In our analysis these fears are justified in some cases, such as businesses offering some marketing tools or customer service functions, and we had already avoided these segments in our funds. Research firm Gartner is a prime example.
- However, in the case of many other companies, investors have ‘sold first, asked questions later’. Where our fundamental, company-level analysis has shown these AI fears to be overblown, we have maintained and sometimes added to our positions, for example, London Stock Exchange Group and RELX.
Company-level examples of fundamentally sound shares that have underperformed include the following:
Stock exchange and data business London Stock Exchange Group (LSEG)
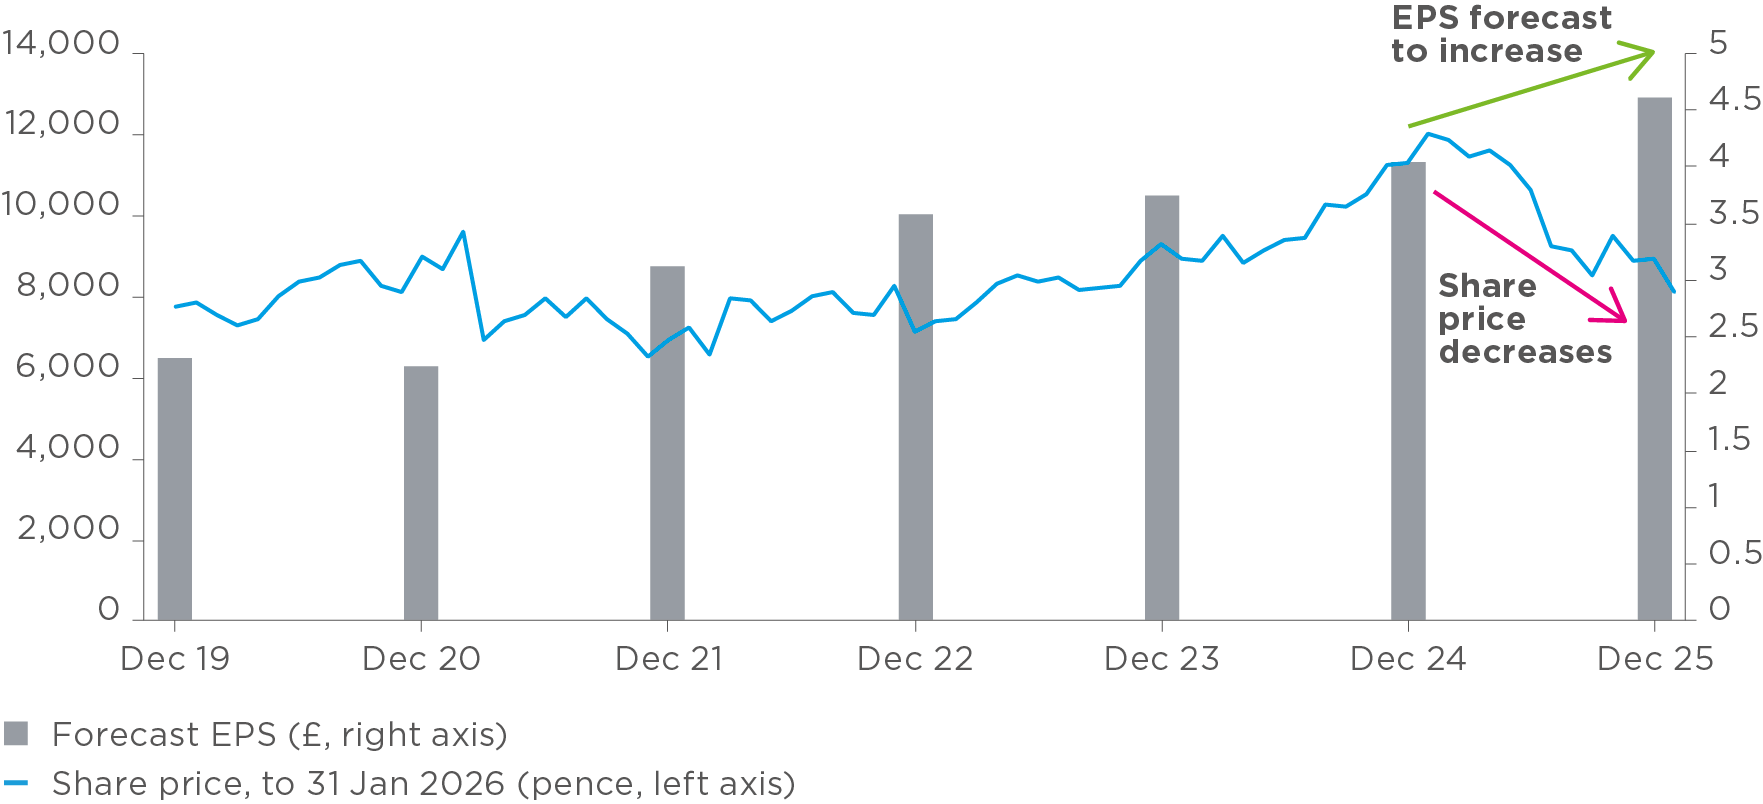
Source: Bloomberg.
- London Stock Exchange Group (LSEG)’s share price fell 21% in 2025, because some investors feared that AI would allow the company’s customers to perform data analysis without paying a subscription to LSEG data.
- LSEG has more than doubled its earnings per share since 2019. And financial analysts still forecast it to increase its EPS by 15% in 2026.
- LSEG’s competitive position remains strong: it owns the proprietary data that AI firms need to offer analysis. In fact, AI serves as an additional revenue channel for LSEG. The company has already signed agreements to supply its data to Anthropic (Claude) and Microsoft (Copilot), with more supply agreements likely to follow.
- LSEG therefore remains resilient, with long-term structural advantages, and strong earnings growth. Activist investor Elliott Management’s purchase of a stake in LSEG in February 2026 reiterates the company’s fundamental attractiveness.
Cloud IT and business process platform provider ServiceNow
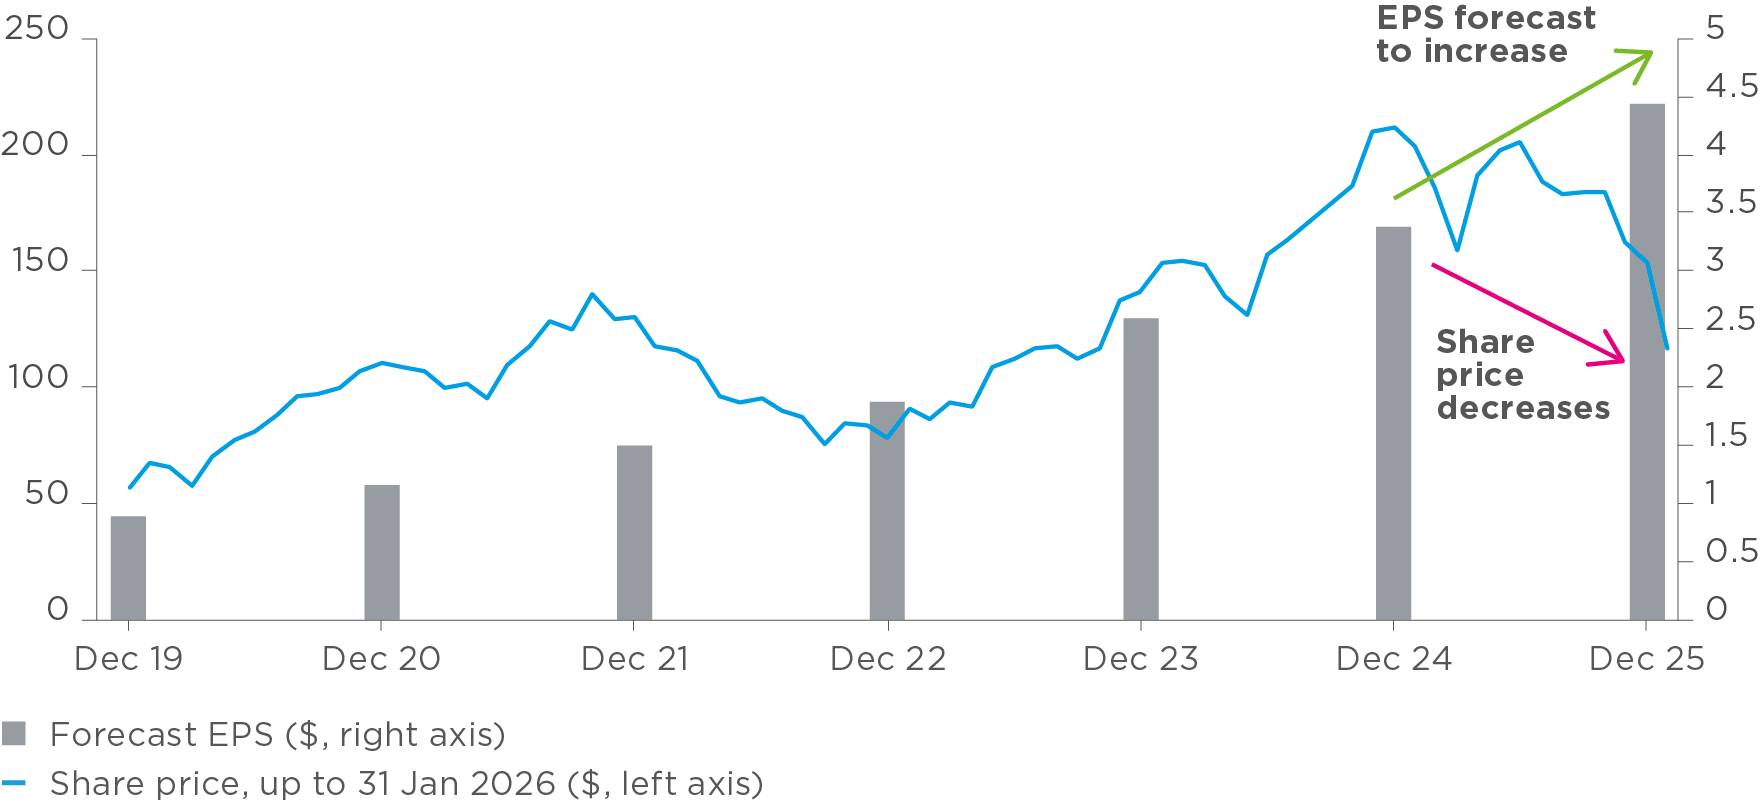
Source: Bloomberg.
- ServiceNow’s share price fell 28% in 2025, over fears that AI would reduce the demand for the company’s business software licenses.
- However, analysts continue to forecast that ServiceNow will grow its 2026 EPS by 32%. Since 2019, ServiceNow has more than quadrupled its EPS.
- ServiceNow’s tools are deeply embedded across its clients’ mission-critical functions such as sales, risk, security, human resources and IT. Switching costs are therefore high, and clients ‘sticky’.
- In addition, ServiceNow has developed its own AI solutions that can automate workflows, from which it expects to generate at least $1 billion per year by end-2026.
Contract caterers Compass
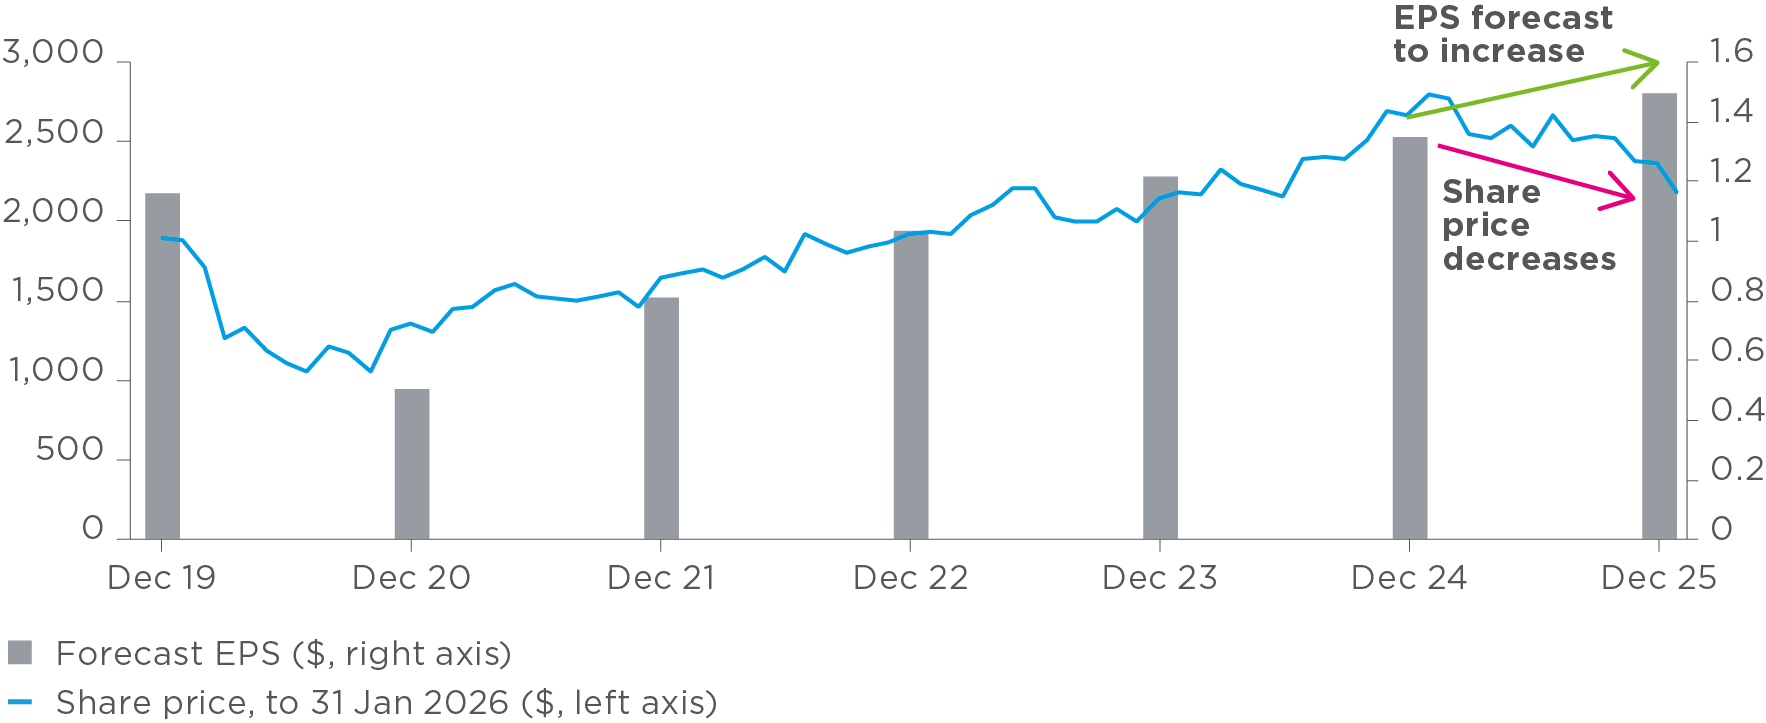
Source: Bloomberg.
- Compass’ share price fell 11% over 2025, mainly because investors worried that AI would lead to job losses, which would slow down the company’s growth.
- However, analysts still expect Compass’ 2026 EPS to grow 12%, compared to 2025, helped by both organic growth and strategic acquisitions, as well as high client retention (over 96%, year on year).
- Our analysis shows that Compass’ long-term growth outlook is intact, supported by the rising penetration of outsourced food services, market share gains and bolt on acquisitions.
- Compass therefore remains a structurally strong compounder of earnings, which CCLA’s portfolios now own, still at a profit but now at a more attractive valuation than before.
In summary…
CCLA buys, holds or sells shares not based on their market performance or ‘momentum’, but mainly based on our fundamental analysis of their quality (steady profit growth, high returns on invested capital, low debt levels).
This means that:
a) where the fundamental quality of an underlying company deteriorates, we reduce the funds’ exposure to that company or dispose of our holding altogether; and
b) where market sentiment weakens, but the quality of the underlying company remains, in our analysis, intact, we hold on to those positions.
By remaining consistent in our approach, we have constructed portfolios at reasonable prices over the years, that have stronger fundamental quality characteristics than the broader stock market as a whole (see figure 3 below).
A comparison of our funds to the broader market demonstrates our bias towards quality shares:
Figure 2: CCLA’s equity portfolio statistics versus the broader market (as of 31 December 2025)
| COIF Charities Investment Fund | MSCI World Index | |
| Price/earnings ratio | 20.4x | 17.7x |
| Gross margin | 47.4% | 26.1% |
| Operating margin | 27.7% | 18.3% |
| Cash flow return on investment | 27.4% | 20.8% |
| Return on equity | 22.0% | 18.5% |
| Sales growth | 9.7% | 6.5% |
| Earnings growth | 13.0% | 13.9% |
| Volatility | 14.9% | 16.0% |
| Net debt to shareholders equity | 27.3% | 38.3% |
Source: CCLA, Bloomberg, MSCI. For definitions and more information, please see our glossary.
As the table above shows, the positions our funds hold are not based on selecting ‘bargains’. In fact: because of their quality features (steady profit growth, high returns on invested capital, low debt levels), they are slightly more expensive than that broader market.
And because quality shares have lagged the broader market for some time, the price premium for buying quality shares has now fallen to an attractive multi-year low.
Figure 3: Premium of the price-earnings ratio of the MSCI World Quality Index over the price-earnings ratio of the MSCI World Index (2013–2026)
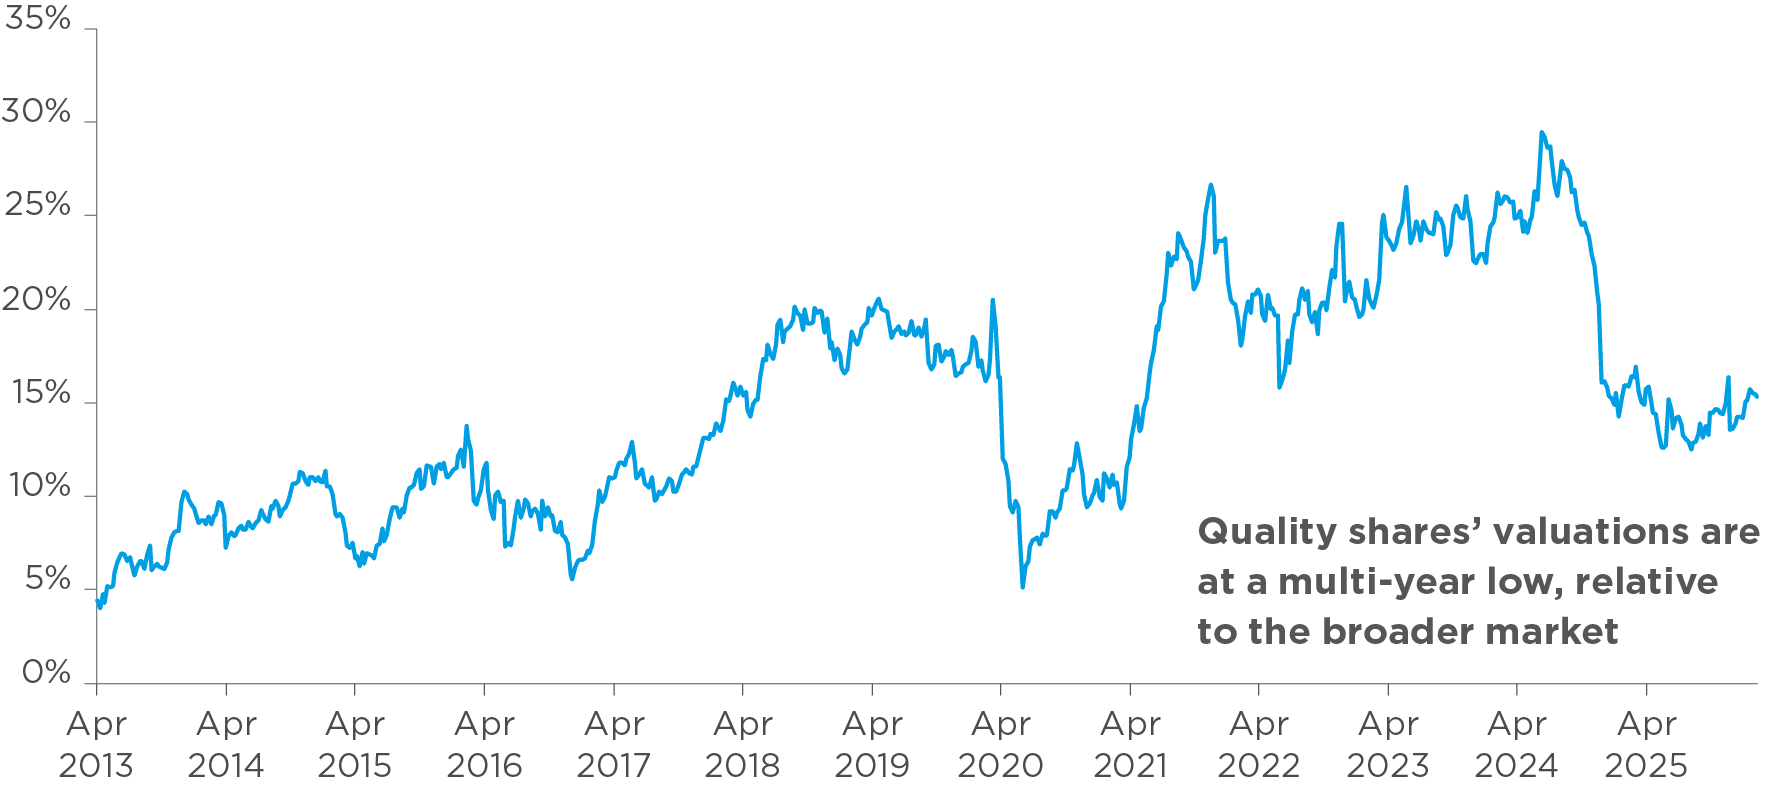
Source: MSCI.
Stock market volatility aside, CCLA’s investment funds continue to provide a growing income to our clients
Our clients require reliable, long-term income to achieve their equally long-term objectives, regardless of stock market conditions. CCLA’s income distributions have delivered that stable and growing income for many years.
Unlike approaches that only look at dividends, we look at the underlying free cash flows from the companies in our funds, which are more stable. (Free cash flow is the cash that a company produces after paying its operating costs, deducting working capital, debt service and capital expenditure.)
As a result, the income distributions from CCLA’s equity and multi-asset funds have never decreased from one year to the next. Even over the COVID years, our funds increased their income distributions.
In addition, as figure 2 shows, the cash flow return on investment of the quality companies in CCLA’s multi-asset funds was 27.4% at the end of 2025, significantly higher than the 20.8% of the MSCI World Index. This strong free cash flow position of the companies in our funds allows us to maximise the income we distribute to our clients.
Figure 4: CCLA’s investment funds have paid out steadily growing income
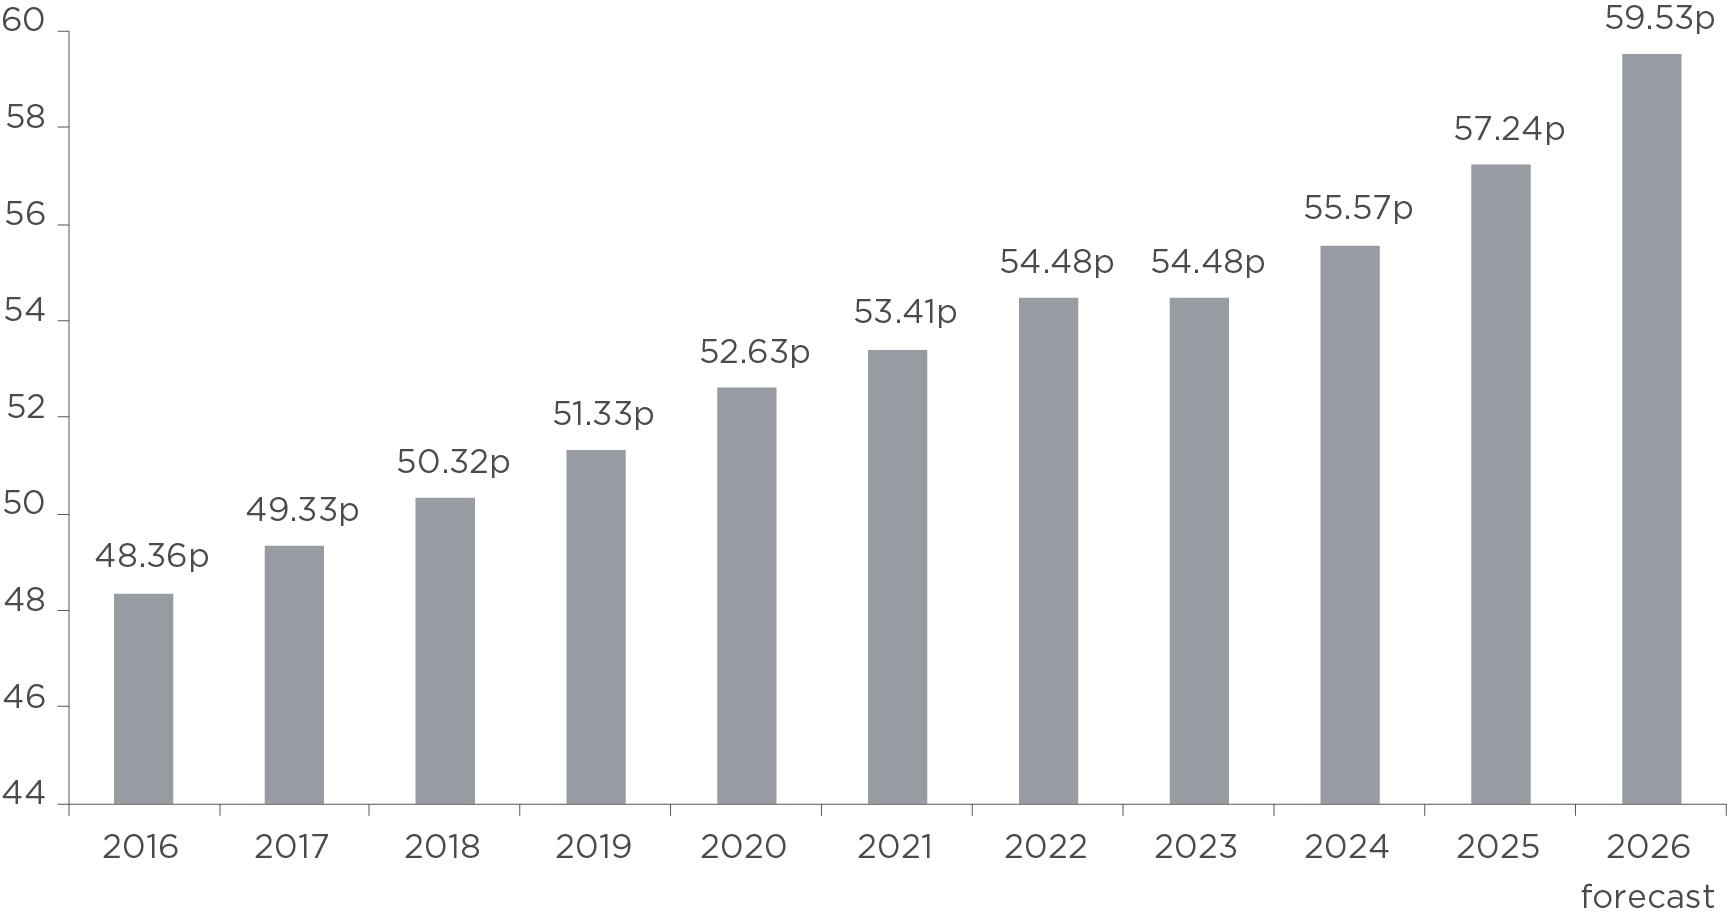
Source: CCLA, data showing the pence per unit distribution for the COIF Charities Investment Fund. For other CCLA funds, please refer to our pricing and income tool.
In summary: the income we distribute doesn’t depend on the price performance of the shares in the portfolios we manage. Instead, it is based on the cash flows of the companies in those portfolios.
For example: even the companies listed above (ServiceNow, LSEG and Compass) have continued to produce strong free cash flow for years. So, regardless of these companies’ share prices in 2025, their underlying fundamentals have been a solid basis for the income we distribute.
Conclusion
Many stock markets have retreated from their recent all-time highs. Last year’s leaders (often in communications and technology) have given way to different sectors in early 2026.
The AI frenzy has boosted some companies’ share prices to great heights, but it has weighed down others.
Some investors base their portfolios on short-term stock market momentum, which is often volatile. As long as companies’ fundamentals continue to take second stage, their approach will continue to look successful.
At CCLA, however, our fundamental research into quality shares remains central to how we invest. And yes, many quality shares have lagged market momentum for several quarters.
In our analysis, the fact that the fundamentals of the companies we hold remain strong bodes well for their future returns. In the meantime, these companies and our funds have continued to provide the steadily growing income on which charities, endowments and churches depend.
1 See ‘Patience Pays: Why Quality Shares Outperform in the Long Run’ and ‘CCLA 2025 investment review and outlook for 2026’.
Important information
This article is for information only. It does not provide financial, investment or other professional advice. We strongly recommend you get independent professional advice before investing. The market review, analysis, and any projections in this document represent CCLA’s house view and you should not rely on them when making any investment decisions. Actual results could be significantly different than expected. We do not have to update or amend these. Past performance is not a reliable indicator of future results. The value of investments and the income from them may fall as well as rise. You may not get back the amount you originally invested and may lose money.