The first order of business is to acknowledge our extremely disappointing investment performance over the past two years. You are frustrated. We are frustrated. We have had and are having a series of very frank conversations with our clients, our oversight boards, and ourselves about why our returns have been poor and what we are doing about it. These conversations have opened our investment process to minute scrutiny and introspection. Throughout we have been honest and open about what’s worked and what hasn’t, what needs to change and what doesn’t.
In this letter we hope to set out clearly the conclusions we have reached. We hope you will be reassured that this has been a blip rather than a new normal for CCLA, and to demonstrate the careful deliberation that has led us to be making the changes that are now in train.
Performance vs investment objective
Let’s start with the numbers. In 2025 the COIF Charities Investment Fund was down 2.0% and the CBF Church of England Investment Fund was down 1.2%, in a year when our investment objective of CPI+4% was up 7.2%. This is the second year in a row that we have lagged our objective as in 2024 both funds were up 5.0% while CPI+4% was up 6.6%. Cumulatively the funds have trailed their objective by 11% and 10% respectively over the two years.
Absolute return by asset class
Looking at performance in absolute return terms, during the past two years we have had reasonable returns from our property book (+8%), private equity book (+9%) and contractual income book (+22%). We have had flat return in our fixed income book (0%) but that has been in line with the broad gilts market (0.7%), and we have been underweight fixed income, so no real damage done.
Two areas have hurt us. We have lost money in our infrastructure book (-8%), driven particularly by weakness in UK renewables infrastructure. The main driver of underperformance, however, has been our equity book, which was up 5% while the MSCI World equity benchmark rose 38%.
Attribution vs comparator
When we look at the attribution of underperformance it’s helpful to compare fund returns with those of a comparator benchmark, which we can think of as the return available to a passive implementation of a standard multi-asset benchmark. The comparator benchmark we use is 75% equity, 15% gilts, 5% each in UK property and sterling cash.
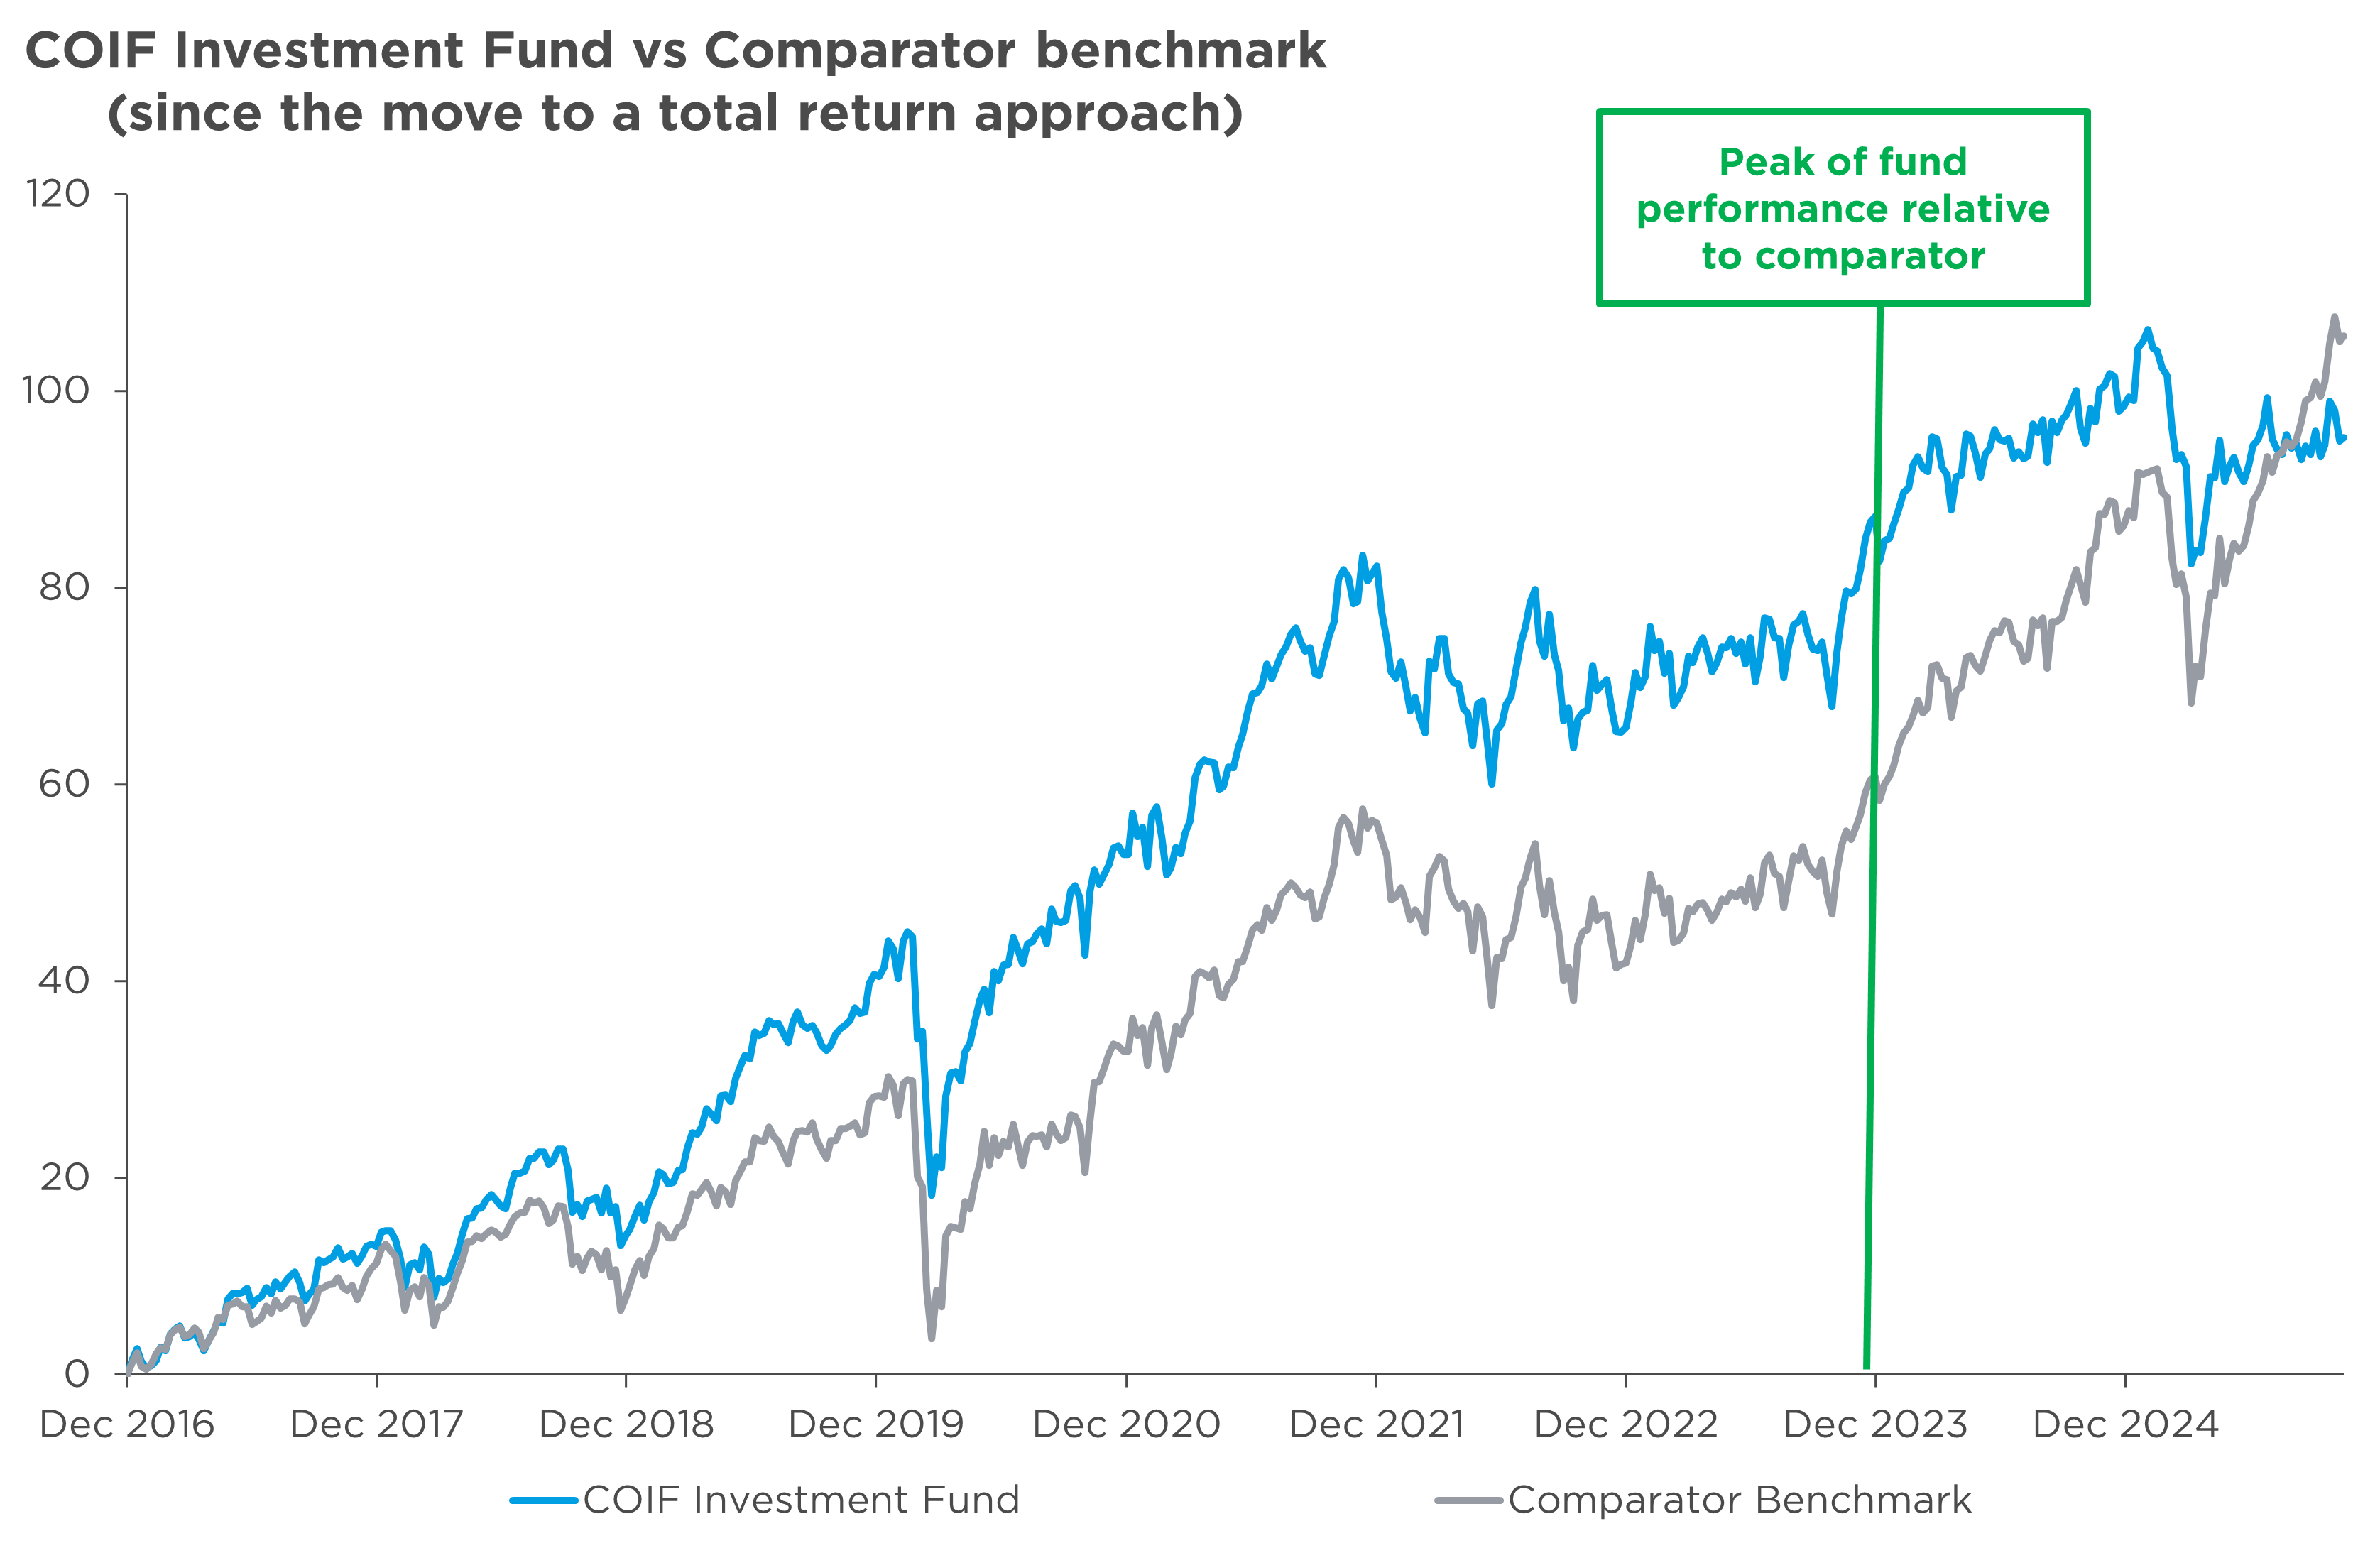
Source: CCLA, data to November 2025. Comparator benchmark: MSCI World Index (75%), Markit iBoxx £ Gilts Index (15%), MSCI UK Monthly Property Index (5%) and SONIA (5%). The comparator benchmark is subject to change. Please refer to detailed description in the appendix. Performance shown after management fees and other expenses, with the gross income reinvested. Past performance is not a reliable indicator of future returns.
This is how the COIF Investment Fund has performed relative to its comparator since CCLA moved to a total return approach to investing in December 2016. The fund achieved seven years of consistent strong outperformance versus the comparator. So the performance problem really has been ‘just’ in the past two years. Over that period the fund is up 3% when the comparator is up 27%.
The table below shows our performance relative to the comparator benchmark over the past two years in two ways – separating out asset allocation decisions from security selection decisions.
| Asset class | Asset allocation | Security selection |
| Total | -1.81% | -22.43% |
| Equity | -0.33% | -21.55% |
| Contractual and other income | -0.18% | 0.00% |
| Fixed interest | 1.86% | -0.14% |
| Infrastructure and operating assets | -3.21% | 0.00% |
| Private equity | -0.78% | 0.00% |
| Property | 0.09% | -0.11% |
| Other | 0.44% | -0.32% |
Source: CCLA and Bloomberg, as at 31 December 2025, using unaudited data.
The key points are:
- Asset allocation decisions have caused 1.8% points of underperformance versus the comparator over the past two years.
- The main driver of this was our allocation to infrastructure, which contributed 3.2% points of underperformance. Other asset allocation decisions have contributed positively.
- Security selection decisions have caused 22.4% points of underperformance.
- The main driver was equity stock selection, which caused 21.6% points of underperformance.
Underlying reasons for underperformance
When we dig into what’s been going on under the hood, we boil the problem down to four issues:
- the de-rating of quality equities
- the penalty to diversification as market value has become concentrated in a small group of mega cap stocks
- the primacy of short-term earnings and price momentum1 at the expense of longer-term market position
- questions of where artificial intelligence (AI) will disrupt existing business models (or not disrupt them).
The first two of these (quality and diversification) are at the heart of our portfolio construction, are core investment values for us as managers of endowment assets and will not change. The second two (momentum and AI-disruption) are areas where we have adjusted/are adjusting our process or have changed our view, and which we would expect to be a source of improvement in our returns.
Let us briefly set out our thinking on each.
Focusing on quality equities
While we don’t just buy quality to the exclusion of all other considerations, we do strongly believe that a quality bias is appropriate for our clients, the vast majority of which are church or charitable endowments, because endowments cannot tolerate the permanent loss of capital. Definitions of quality vary but all tend towards stocks with sustainably high returns on capital, strong cash flows, low volatility of earnings and strong balance sheets. In other words, stocks whose margins and return on equity are less susceptible to the ups and downs of economic or interest rates cycles, and which are self-sustaining in terms of generating capital. This combination of features minimises the risk of permanent loss of capital because these companies very rarely go bust.
There is a but, however. In hindsight, we must acknowledge that quality as a style had become quite stretched on valuation versus the market 18 months ago. The chart below shows the price-earnings (PE) ratio of the MSCI World Quality Index relative to the market.
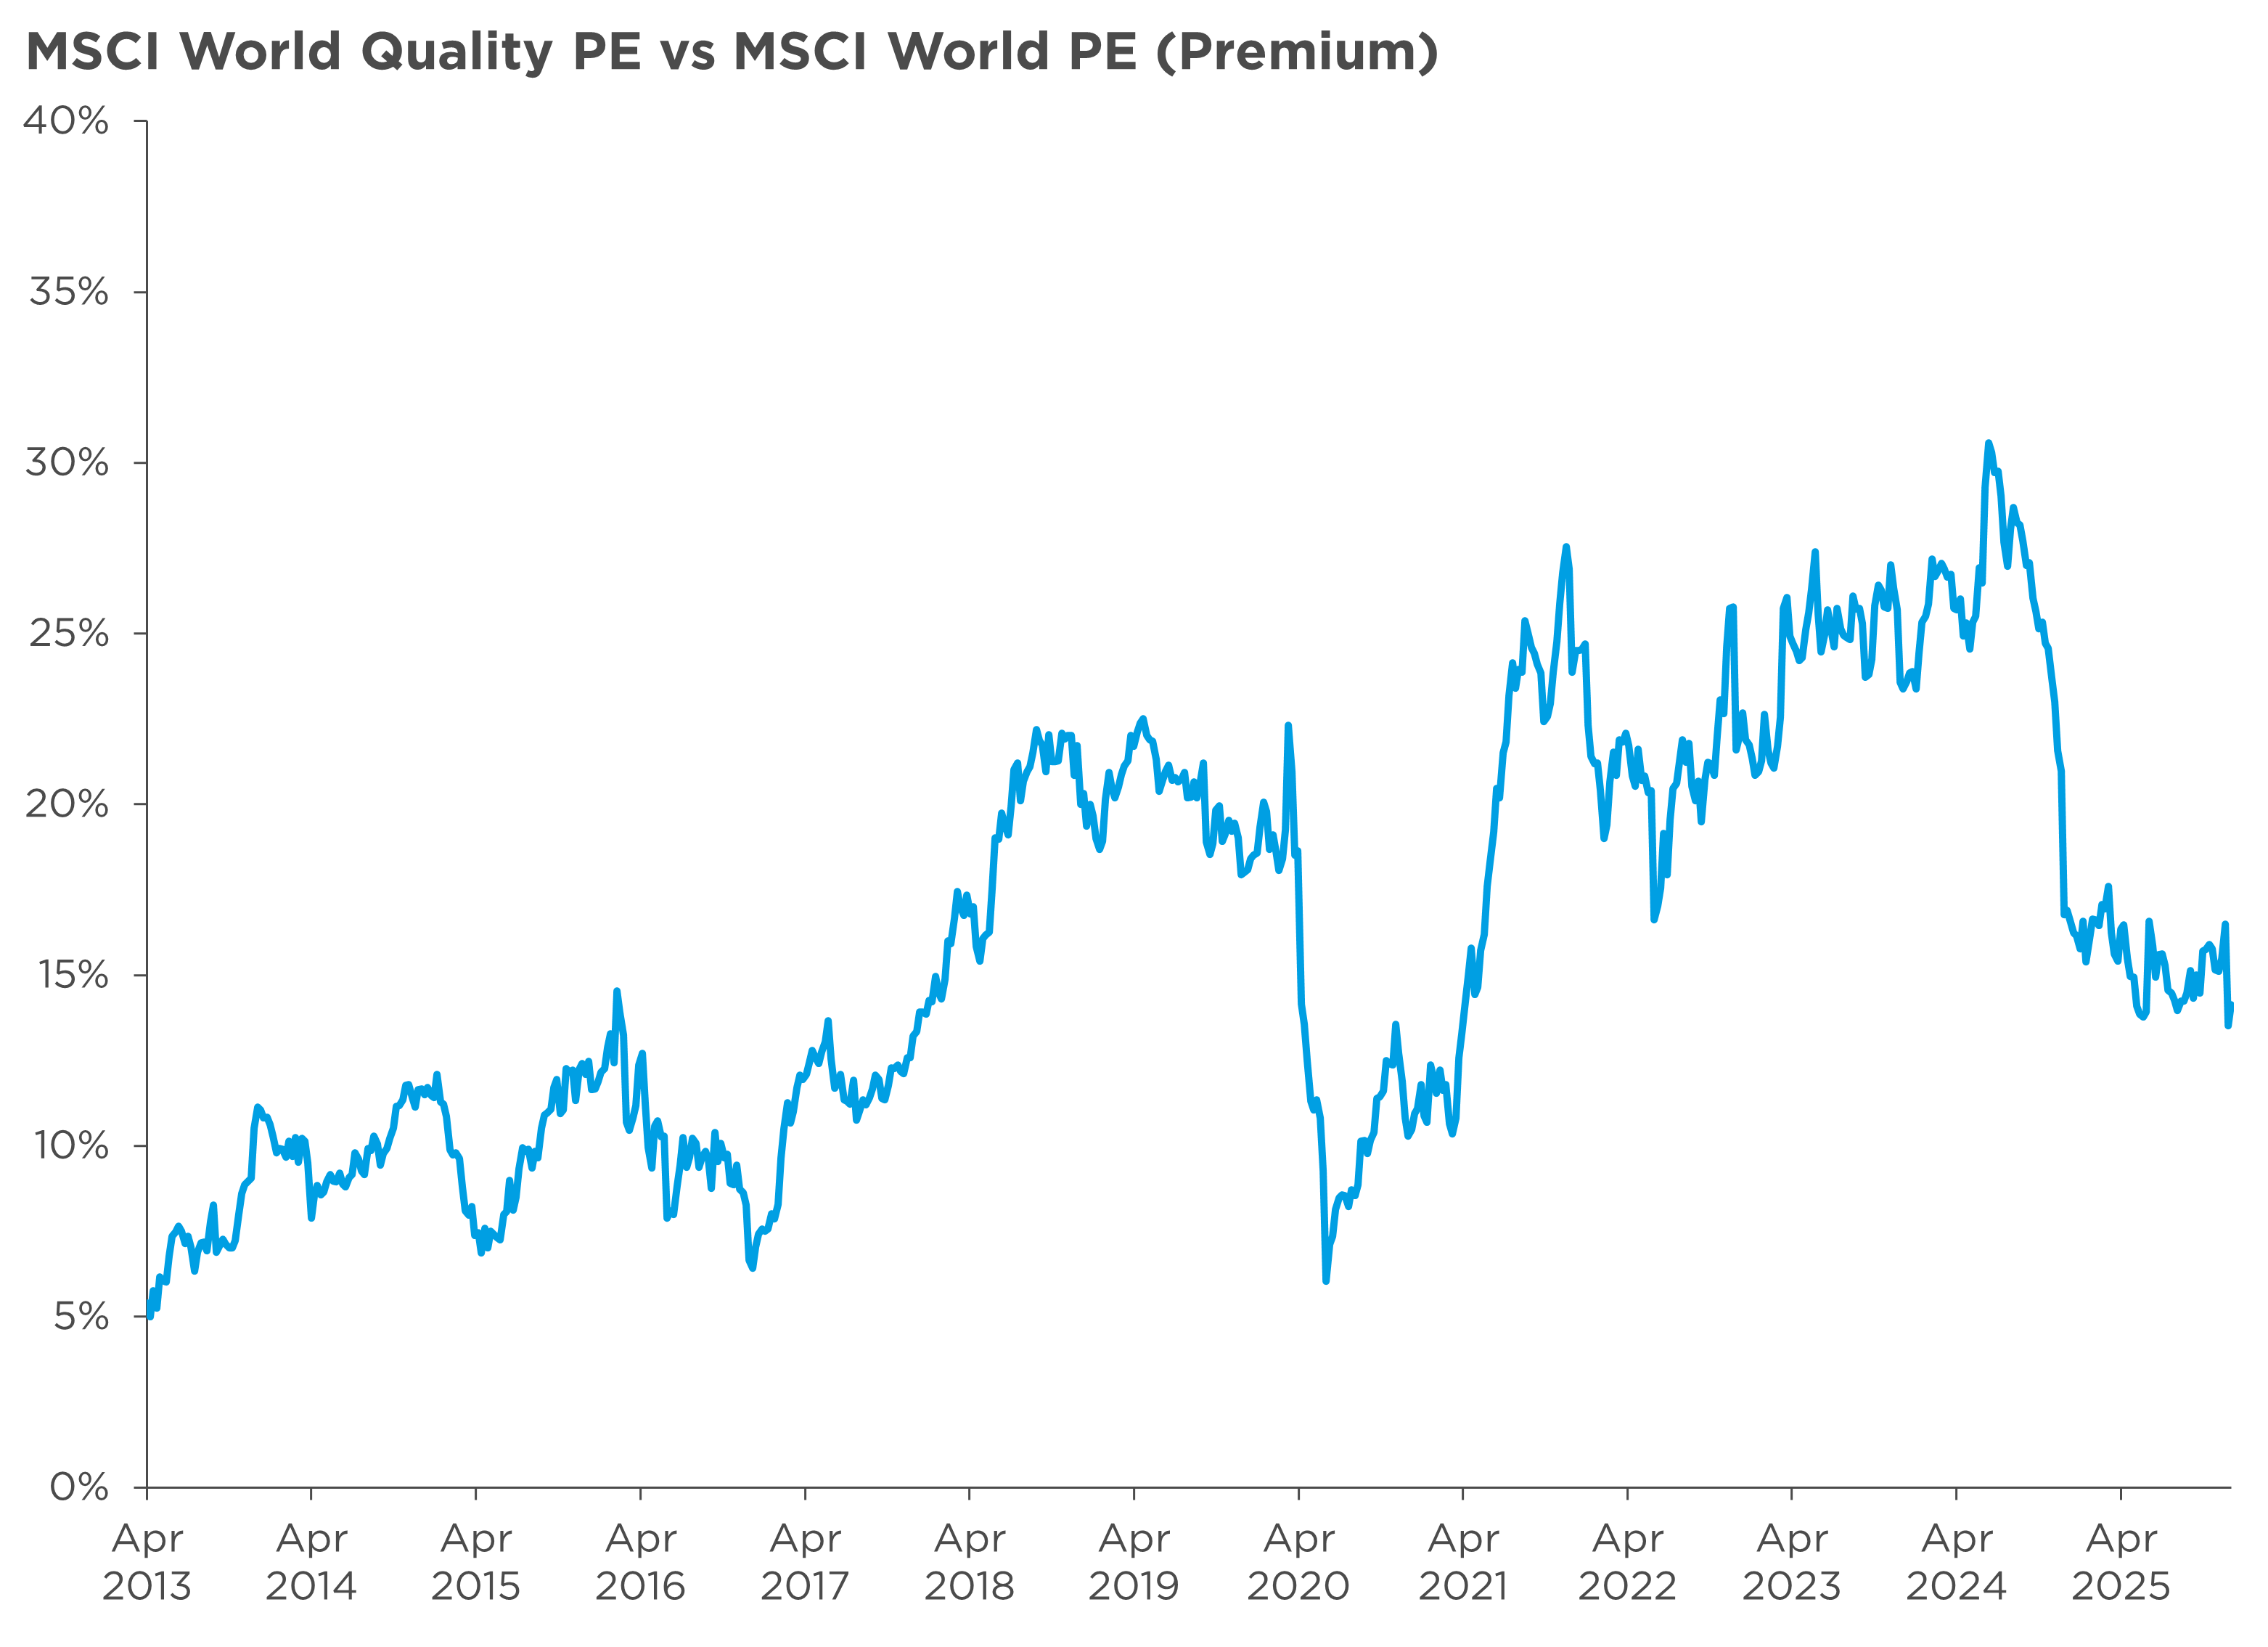
Source: Bloomberg blended 12-month forward consensus earnings per share (EPS) used for PE calculations.
Clearly, quality equities should trade at some kind of valuation premium to the broader market, precisely because they have higher and less volatile ROE2 /CFROI3 than the broader market. The question is how much should that premium be? As we emerged from the pandemic, quality broke out to new valuation highs, reaching a 30% PE premium to the market by early last year. Since then, they have de-rated to a more reasonable 14% premium. Could they de-rate further? Yes maybe. A 10% premium has been a very good level for forward outperformance in the past, and a 5% premium has been the absolute low as you can see in the chart over the past 12 years for which we have data.
What we can say now is that if quality stops de-rating versus the market, and if the quality stocks we pick can maintain their high CFROI, then our stocks should outperform. Two big ‘ifs’, maybe, but nonetheless two assumptions we feel we can make. For reference, our equity book today has a CFROI of 26%, fully 5% points more than the market, and trades at a PE premium to the market of 18% (PE of 21 vs market PE of 17.8) – one of the lowest premiums that the book has traded on in the last 10 years.
The penalty to diversification
The second way we attempt to minimise the risk of permanent loss of capital is by being intentionally more diversified than the market. It’s an empirical fact that a 100-stock portfolio all else being equal will have lower return dispersion than a 50-stock portfolio which will in turn have lower return dispersion than a 20-stock portfolio. We run a 70–90 stock equity portfolio with precisely this in mind. As we add to the number of names we tighten the range of outcomes around our expected return and minimise the risk of a big left tail outcome which equates to a permanent loss of capital.
That’s the theory. What has happened in the past five years is that the market has become ever more concentrated in a smaller group of names. As this process has happened, it has been a headwind to performance. This, however, is a second feature of our portfolio construction that we view as essential to reducing undue single stock risk, and one that we do not plan to change.
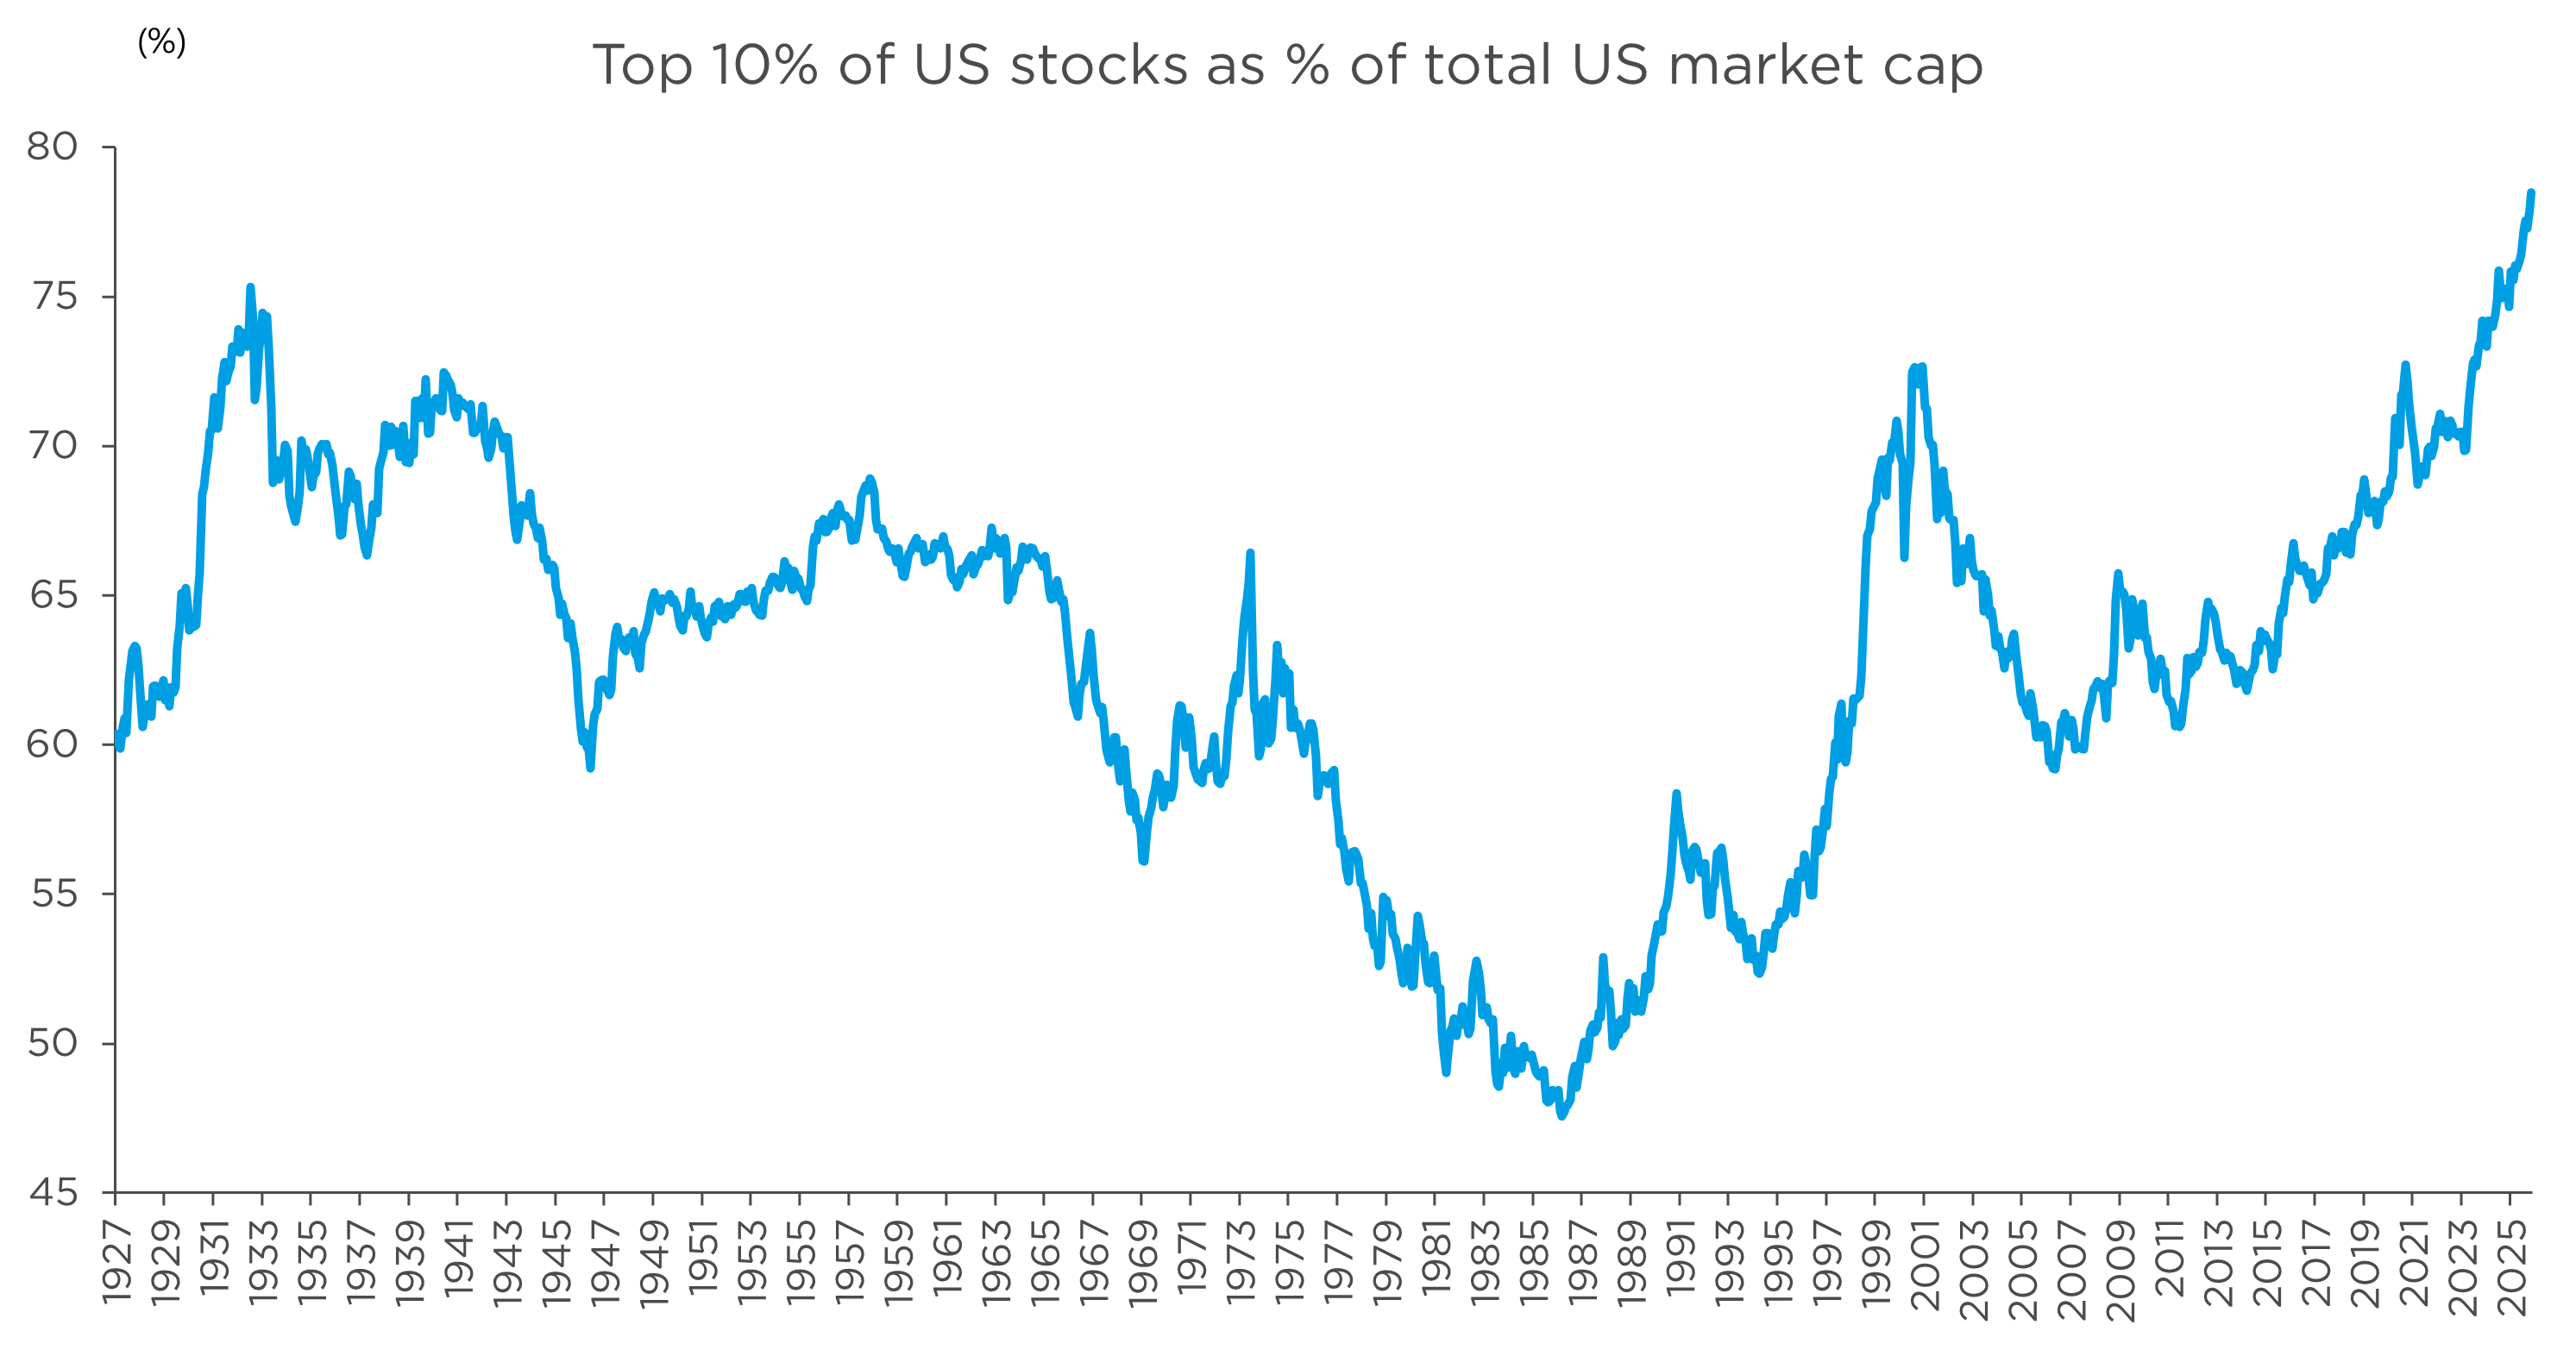
Source: Kenneth R. French data library, Centre for Research in Security Prices (CRSP), Jeffries. Data as at November 2025. Estimates based on CRSP database for US stock market.
The primacy of momentum
The combination of a long bull market in equities, the exponential rise in social media use and the emergence of a potentially game-changing new technology (i.e. AI) have resulted in a marked increase in financial risk appetite in the general population. As retail participation in equity markets has increased, investor time horizons have shortened. Trading platforms such as Robinhood Markets have specialised in giving retail investors access to leveraged instruments such as ‘zero day to expiry options’ (0DTE options) – options which expire on the close of the day they are traded, thereby allowing ‘investors’ a leveraged one-day bet on a stock or index. 0DTE options are now 62% of all options activity in the S&P 500, for example. Good short-term news is immediately rewarded in an outsized manner, and bad short-term news punished commensurately. What we see as a result is the ‘strongest momentum market on record’ (to quote veteran quant analyst Mike Goldstein at Empirical Research).
While these factors may not last forever, they may also not go away soon, and we should at least take account of them. To be honest, earnings momentum nearly always works – stocks with upgrades outperform, stocks with downgrades underperform. QED. CCLA has always taken a long-term view of fundamentals and where stocks we like have had shorter-term (cyclical) earnings headwinds we have typically used that weakness to add to our positions provided we still have confidence in the long-term earnings drivers of the business. In this market, that has often been the wrong thing to do.
In hindsight, we were too exposed to stocks which, while still good quality, had slowing earnings revisions versus other areas of the market where prospects were improving, such as banks. Given how volatile earnings revisions are it’s hard to adjust portfolios at the single stock level for movement in short term earnings momentum, but we can address this directly via some new absolute return strategies that we are introducing and are discussed later in this letter. We can also be more aware of the damage negative revisions can do and use it as a factor in our single stock decision-making. At our weekly portfolio meeting we now look at the aggregate portfolio exposure to positive and negative three-month earnings momentum. While we do not want to lose sight of the dominant longer-term fundamentals which have always driven our stock selection, it does help us to see if we are too heavily weighted to negative revisions, allowing us to take action by adjusting weightings.
Sector calls and AI disruption (or not)
AI has clearly been the dominant narrative in markets over the last two years. In 2024 the focus was very much on the beneficiaries of AI capex, most notably Nvidia and semi-conductor supply chain. We had exposure here, but not as much as the market. In 2025 this excitement has spread into other beneficiaries of data centre spending such as memory, cooling equipment or power. But the market has also started to ask who the possible losers from AI will be. At this early stage it is hard to be definitive, but AI is already making coding quicker and easier and it is also helping users to access and analyse data in a more efficient way. For software businesses or companies who make their money from selling analytical tools this could be a significant threat and we have started to see this priced into stocks across the financial, industrial and technology sectors.
However, we view this as unfairly indiscriminate. Some businesses are more vulnerable to AI and where this is the case we have exited, for instance Adobe. However, others are much better placed. In software, for example, Intuit provides accounting and taxation software for small enterprises, critical systems which incorporate non-public historic data, where reliability is paramount and switching costs high. Moreover, Intuit is already using AI tools to enhance its products helping drive double digit earnings growth. Market infrastructure names such as London Stock Exchange or professional services stocks such as Relx provide some of the widest and most accurate data sets in the world, often proprietary and all embedded into the workflows of their customers. Both have been early adopters of AI and are already showing revenue from these new tools. Earnings have continued to grow and valuations are now very compelling.
Another area of weakness for our portfolios has been healthcare. For many years this was one of the larger areas of exposure and a successful one, benefiting from the growing demand for treatment from ageing populations and continued innovation in drugs and devices. However, the sector has struggled in the last couple of years due to an overhang in spending post Covid, weaker biotech funding and in 2025 political pressure from the Trump administration. Threats to academic and research funding particularly impacted our life science holdings. We reassessed our exposure, focusing down onto the strongest franchises, and since the summer we have seen a resurgence in share prices as White House dealmaking and attractive valuations have seen market confidence return.
What aren’t we changing?
Those are the factors behind our underperformance of the last two years. We won’t budge from our quality bias, nor will we concentrate the portfolio into fewer names, for the reasons we have given. But we are making changes which we think will improve returns in future and we summarise them here.
Changes we are making
- We have always evolved our investment approach and given recent performance these efforts have only intensified. We take a long-term approach, but we also want to ensure we are challenging our convictions, making use of our team expertise and our quant tools to take action where positions are not working. We have taken steps to streamline our short review process to get new ideas from our screens into discussion more quickly. We retain a valuation discipline and we trim or exit positions where valuations are excessive, but are also mindful that moving to cheaper, second best, names can bring its own risks. Equally, where earnings momentum is strong, we should be prepared to hold positions for longer. Finally, for portfolio construction we have narrowed down our decision-making group to ensure timely action in the face of changing market conditions or emerging new themes.
- Make an allocation to a long-only systematic equity strategy4 that is run (by us) directly off the quantitative screens we use as entry filters for our stock selection. We have run these in parallel as a cross-check on our stock selection for a number of years and they have performed well, doing particularly well in the momentum market of the past few years – partly because they can tolerate higher stock turnover than our core equity book and so can adjust to shorter term momentum more quickly.
- Make allocations to two diversifying absolute equity return strategies5 that target earnings momentum directly, among other factors. We will tell you more about this in future communications, but we have been working for a year on two new diversifying strategies that perform particularly well when equity markets fall and have a positive expected return over the longer term. We expect them to be implemented across the multi-asset funds during Q1 2026.
- Make an allocation to a basket of commodities. In the past we have avoided investing in non-free cash flow generating securities (in order to underwrite our fund distributions) but during Q4 2025 we obtained approval from our Investment Committee to make an allocation to a mix of precious and industrial metal exchange-traded commodities. The rationale for this change is that government debt and deficits show no sign of coming under control and debt monetisation becomes an ever-greater risk. If we restrict the scale of our allocation we can continue to underwrite our distributions with free cash flow while also partially mitigating monetisation risk.
To start with around 8% of the portfolio will be moving to these new strategies and over time that could grow to an absolute maximum of 20% of the portfolio, but only if we were at maximum allocation to all four new strategies simultaneously, which is unlikely. We strongly believe they will improve returns over time, of course, but we can’t ever be sure of precisely when they will work best.
Expected returns
Albeit there are no guarantees, we would like to finish by setting out our expectations for portfolio returns over time. We look at these in two ways.
First, we assess the expected returns for the asset classes we are exposed to multiplied by the fund weight in those asset classes – analysis that we update for market moves every month. As things stand, we expect our current asset allocation should generate a return of CPI+4.3% annually over a five-year period.
Second, we look at our expected internal rate of return in our equity book which currently stands at 10% nominal, 7.5% above UK CPI. It is important to point out that the underlying free cash flow of the funds grew 11% in 2025, we calculate, while the funds fell 2–3%.
So while it’s absolutely true that the market de-rated the stocks we hold, those stocks did actually deliver the underlying financial performance that we are targeting. We are just as convinced that the book we hold now has all the ingredients needed to return CCLA to exceeding your investment objective, and the changes we are making should only improve that outlook. Time will tell, but we are optimistic.
While we have focused on the areas that have not worked as hoped in this paper, we do believe we have a portfolio of great businesses with exciting fundamental prospects. Themes we have exposure to, of course, include AI with holdings such as Broadcom, TSMC, ASML and Google. Beyond this, in industrials we own businesses such as Siemens, a leader in industrial automation and digitisation, and Epiroc, a provider of mining equipment particularly to the copper and gold mining industry. In consumer discretionary our exposure ranges from leaders in ecommerce such as Mercado Libre to global franchises such as IHG, beneficiaries of increasing expenditure on travel. In health care we own innovators in the treatment of diabetes and cardiovascular disease such as Abbott as well as manufacturers such as Essilor Luxottica, the world’s leading vision lens and frame company. Finally, in financials our exposure ranges from fast-growing emerging market banks such as HDFC to market infrastructure names such as Tradeweb who are providing the tools to automate fixed income trading.
Taken as a whole, our portfolio provides exposure to businesses with higher returns on equity than the market, better balance sheets, strong profit margins and as good if not better growth. The valuation premium to the market has compressed and we believe these fundamentals should be rewarded in the future.
| Metric | COIF Investment Fund | Equity benchmark | +/- |
| PE ratio | 21.02 | 17.77 | 3.26 |
| Operating margin | 27.1% | 17.8% | 9.2% |
| Cash flow return on investment | 25.8% | 20.7% | 5.1% |
| Volatility | 16.1% | 17.6% | -1.5% |
| Net debt to shareholders’ equity | 30.6% | 37.6% | -7.0% |
Source: UBS HOLT and UBS Quant Answers, as at 30 September 2025. Equity benchmark: MSCI £ World. Risk metrics and portfolio characteristics are for equities only.
Before closing we would just like to say that the CCLA investment team is looking forward to joining the Jupiter team. We will have broad exposure to the knowledge base of seasoned investment professionals across equity, fixed income, commodities and absolute return, which can only be a positive, we think.
We end by thanking you for your forbearance and reiterating our confidence that the refreshed approach and portfolio is well placed to deliver the investment returns that you need to fund the wonderful things you do for the world.
1 Momentum in investments is a trading strategy based on the idea that securities which have been performing well (rising in price) will continue to outperform, and those that have been underperforming (falling in price) will continue to lag, at least in the short to medium term.
2 Return on equity (ROE): net income divided by shareholders’ equity.
3 Cash flow return on investment (CFROI): represents the economic rate of return a firm earns on its total capital base and takes into account both on- and off-balance sheet assets.
4 A long-only systematic equity strategy uses computer algorithms and data to consistently buy (go ‘long’) stocks expected to perform well, aiming for long-term capital growth by identifying and harvesting factors (like value or quality) in a disciplined, rules-based way to capture market upside.
5 Diversifying absolute equity return strategies aim to generate positive returns with low correlation to the broader stock market, providing portfolio stability, especially during volatile periods when traditional stocks and bonds may fall in tandem.
Important information
This is a financial promotion and is for information only. It does not provide financial, investment or other professional advice. Past performance is not a reliable indicator of future results. The value of investments and the income from them may fall as well as rise. You may not get back the amount you originally invested and may lose money. Any forward-looking statements are based on our current opinions, expectations, and projections. Actual results could be significantly different than expected. We do not have to update or amend these.
To make sure you understand whether our product is suitable for you, please read the key information document and the scheme particulars and consider the risk factors identified in those documents. The sustainability approach for each of our funds is outlined in its consumer-facing disclosure document. We strongly recommend you get independent professional advice before investing.