November 2025
Quality shares’ performance has been hard to predict from one quarter to the next. But in the long run, their outperformance, of the broader market and of growth shares, has been significant.
In addition, at times of crisis in the last 25 years (dotcom crash, global financial crisis), quality shares’ prices have fallen less than the broader market or than growth shares, and they have recovered more quickly.
Finally, both quality shares and the broader stock market have a significantly higher dividend yield than growth shares, which can support income.
Trustees often ask us: ‘How has my portfolio performed this quarter?’ or ‘What do you expect markets to do next quarter?’ They are right to keep a close eye on their investments, but single quarters aren’t the most helpful way of gauging long-term success.
2025 is a good example. In January, President Trump returned to power with company-friendly tax cuts and deregulation. But over the first quarter, the MSCI World Index fell 3.6%. In April, Trump announced tariffs that many considered negative for the US economy. But the index rose 9.5% in the second quarter. And since the end of June, when tariffs came into force, to 30 September, the index had risen another 7%.
So, who can say for sure what the next month or the next quarter will bring? Some ‘star investors’ claim that they can time the market. But evidence shows that those who try to do so end up with poor returns. Stock market patterns, judging by the data, mainly exist in the long run.
With that lesson in mind, we at CCLA don’t change tack from one quarter to the next. Instead, we invest in quality shares , at reasonable valuations, which has served our clients well over the long run.
Figure 1: Over the long term, quality shares have significantly outperformed the broader stock market.
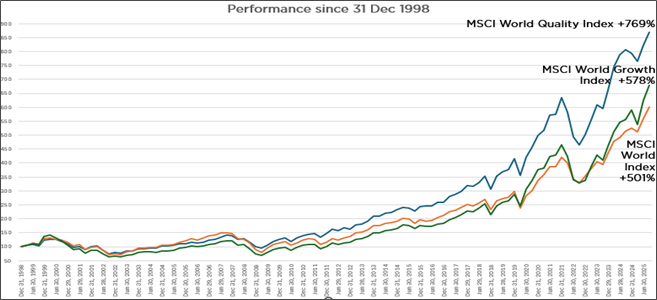
Source: CCLA, Bloomberg, MSCI (returns net of withholding tax, in local currency). Past performance is not a reliable indicator of future returns.
Historically, quality shares have outperformed. But how often? And why?
Adhering to quality as an investment style doesn’t mean that an investor outperforms the broader market every quarter. Or even every year. But quality shares have outperformed, with convincing regularity, over five and 10 years.
Here’s what the numbers look like, based on MSCI’s quality, world and growth indices:
Figure 2: Quarterly, annual, five-year and 10-year performance: the longer the timeframe, the more convincingly quality has outperformed.
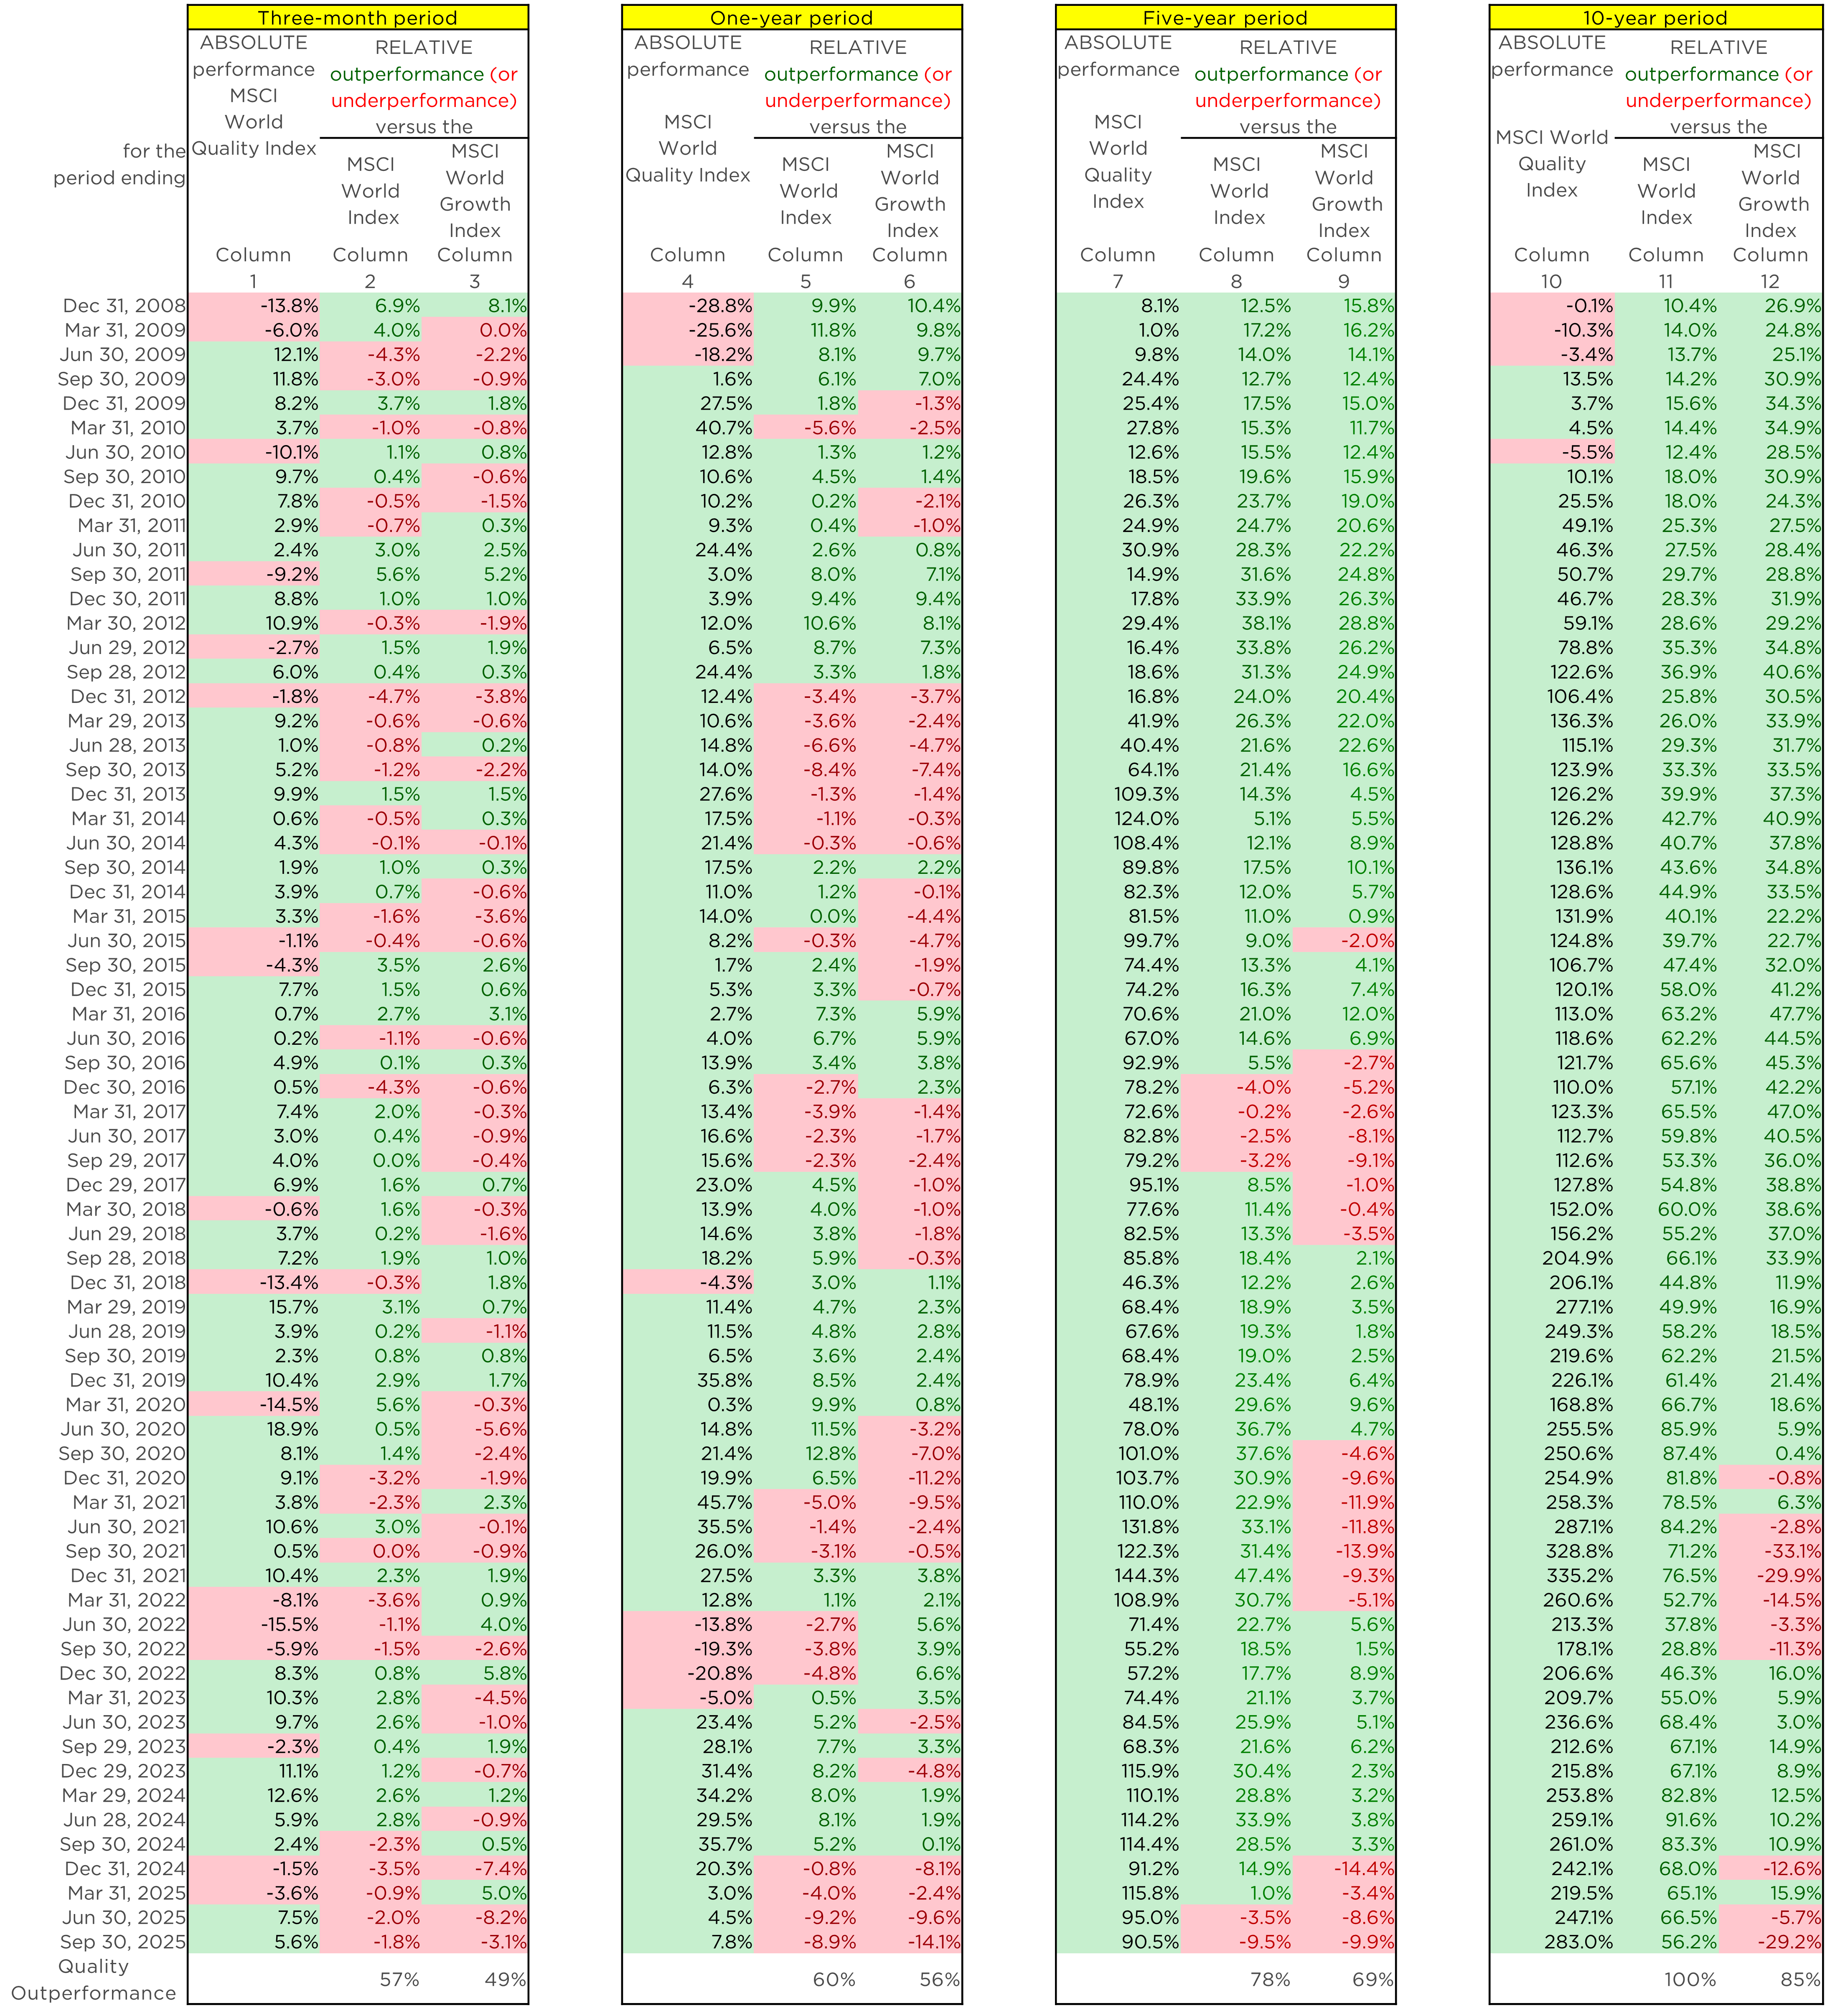
Page 2 looks crowded, but the data on it is straightforward:
Over each of the four time periods (three months, one year, five years and 10 years), figure 2 compares the MSCI World Index (1,320 companies from 23 countries) with its smaller sub-indices the MSCI World Quality Index (300 highest-quality companies from those same countries) and the MSCI World Growth Index (603 companies that score highest on MSCI’s ‘growth’ criteria).
The MSCI World Quality Index includes companies with high returns on equity, stable year-on-year earnings growth and low debt levels. Banking giant JPMorgan, for example, isn’t in the MSCI World Quality Index because, as with many banks, MSCI considers it has high levels of debt.
The MSCI Growth Index includes companies with high growth rates in revenues, in earnings per share and in retained earnings. It includes, for example, NVIDIA, but not facebook parent Meta, because MSCI considers Meta’s growth too low.
For each of the four time periods in the table, the left hand column shows the actual return (with gross dividends reinvested) over the period from the MSCI World Quality Index1. Each box will either be green, where the return was positive, or red, where the return was negative.
The figures in the next two columns for each time period show the relative performance of the MSCI World Quality Index against the MSCI World Index and the MSCI World Growth Index. Each box will be green , where the Quality index had a better return, or red, where the Quality index had a worse return. The numbers in these boxes show by how much the Quality index outperformed (positive and green) or underperformed (negative and red).
Column (1), for example, shows the performance, in absolute terms, of the MSCI World Quality Index, for three-month holding periods (quarters) ending on the dates shown. Column (2) shows the relative performance (outperformance in green, underperformance in red) of the MSCI World Quality Index versus the MSCI World Index. Column (3) shows the relative performance of the MSCI World Quality Index versus the MSCI World Growth Index.
Columns (4) to (6) show the same absolute and relative performance, but for the one-year period. Columns (7) to (9) show the same data for five-year timeframes and columns (10) to (12) for 10-year timeframes.
What does figure 2 demonstrate? And why has quality outperformed?
The big picture is as follows: the left-hand side of page 2 is a patchwork of reds and greens, as quality shares underperform and outperform along lines that are hard to predict from one quarter to the next or even one year to the next.
By contrast, the right-hand side of page 2 is mostly green. This demonstrates that, in the longer run, quality companies’ shares have consistently outperformed.
In other words: the longer your time horizon, the more likely it is that the shares of quality companies have outperformed the broader market. That outperformance goes from 57% of all quarterly horizons (bottom row of column 2) to 78% of all five-year horizons (bottom row of column 8) and 100% (!) over all 10-year horizons (bottom row of column 11).
To summarise: the MSCI World Quality Index has outperformed the broader MSCI World Index over all 10-year timeframes since 1998. That’s a remarkably consistent performance.
Figure 3: Historically, quality shares have outperformed the broader stock market.
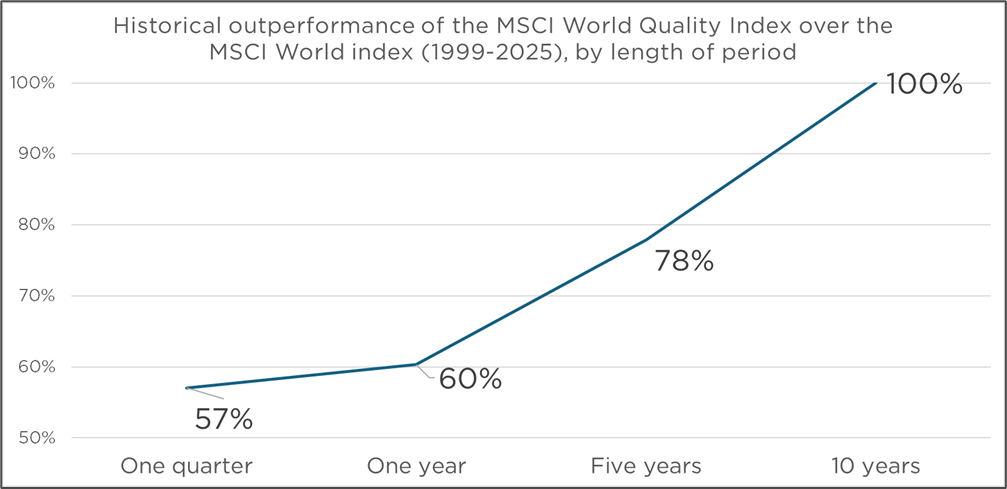
Source: MSCI, CCLA. Past performance is not a reliable indicator of future returns.
Quality shares have also outperformed (currently popular) growth stocks. That effect has been stronger the longer you have held quality shares, up to 85% of the time over a 10-year time horizon.
The remaining 15% of the time, quality shares have lagged growth stocks because of infrequent, structural changes:
- For example, quality shares underperformed growth shares for six quarters in 2021-2022, because that’s when, during Covid, investors piled into growth shares such as Peloton and Zoom.
- Right now is the second time in the period under review when quality shares lag growth shares. Nobody knows what will happen to the current bull market in growth shares driven by AI. But investors are increasingly anxious about record market concentration, and AI insiders themselves are signalling that their sector might be overvalued.
OpenAI’s Sam Altman, for example, considers that investors are ‘overexcited about AI’. And renowned tech investor James Anderson has pointed out that some of the $100bn that NVIDIA invested in OpenAI will flow back to it as revenue, akin to the ‘vendor financing’ that preceded the dotcom crash.
In addition, during the 15% of quarters when the 10-year performance of quality shares lagged growth stocks, quality shares’ absolute performance remained strong: between 178% and 335%.
The bottom row of column 3 in figure 2 is particularly interesting. “49%” shows that, on a quarterly basis, quality shares lagged growth shares more than the other way around, i.e. over the short run growth shares outperformed slightly more often.
Nevertheless, using the same returns over a longer run, e.g. five years or 10 years, quality outperformed growth 69% of the time (over five-year periods, column 9) or 85% of the time (over 10-year periods, column 12), respectively.
Why this paradox between the short run and the long run? Let’s look at figure 4.
- During the Global Financial Crisis, in 2007-2009, the MSCI World Quality index fell 33%, top-to-bottom, and recovered in two years.
- By contrast, the broader stock market (MSCI World Index) fell 47%, and took just over four years to recover.
- The MSCI World Growth index fell 43% and took four years to recover as well.
To summarise: when the Global Financial Crisis (GFC) happened (and, before the GFC, the dotcom crash), prices for quality shares fell less than the broader market or the market growth shares, and they recovered more quickly.
As a result, quality shares needed less time and lower returns to recover losses sustained in these crises. In our opinion, this characteristic makes quality shares better for long-term performance.
Figure 4. The 2007-2009 Global Financial Crisis (GFC) demonstrated a key strength of quality shares: they fared better in the market sell-off, and they recovered more quickly.
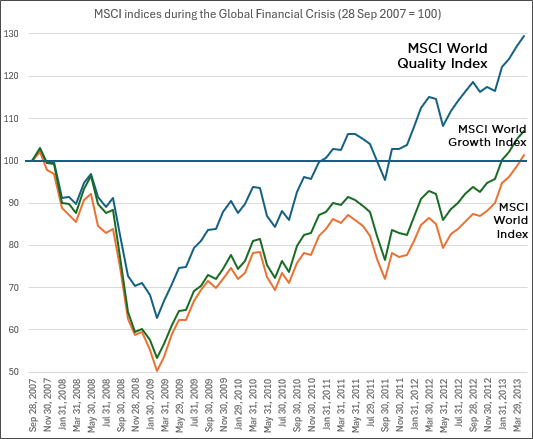
Source: MSCI, CCLA. Past performance is not a reliable indicator of future returns.
A second characteristic is that quality shares during our review period displayed what academics call ‘persistent returns’. When quality shares outperformed, they outperformed for longer periods at a time. This means that they compounded their positive returns for longer, uninterrupted periods.
Finally, quality shares have different income characteristics from growth shares. As of 30 September 2025, for example, the 1.25% dividend yield of the MSCI World Quality Index was nearly double that of the MSCI World Growth Index (0.69%).
This difference in dividend yield means that, for growth shares, share price growth is the dominant source of investment returns. The performance of quality shares, by contrast, relies on both share price growth and dividends. In other words: investing in quality shares offers a more diversified return than investing in growth shares.
Conclusion
Quality shares have now lagged the broader share market for five quarters in a row – for the first time in more than 15 years. That lag is testing the patience of many investors. Even if you hold a portfolio of quality shares, you may well be disappointed to have earned much less than this year’s return from growth shares such as NVIDIA.
Despite that disappointment, however, figure 2 demonstrates that quality shares have outperformed over longer time periods. As the relevant time periods reach five and 10 years, quality shares have outperformed the broader market 78% and 100% (!) of the time, respectively. Historically, sticking with quality has been a better strategy than walking away.
At CCLA, we heed that lesson. And, because of how stock markets work, we realise that patience in the short run is necessary to achieve outperformance in the long run. It is critical, therefore, that we maintain our investment discipline, but also continue to have a realistic view of our investment horizon.
1 Source: MSCI. All data as of 30 September 2025, unless otherwise stated.
2 ‘[S]imple math says market timing is more likely to lose than to win.’ Metcalfe, Guy. ‘The mathematics of market timing’, School of Mathematical Sciences, Monash University, 2018.
3 CCLA’s equity holdings are selected based on CCLA’s quality criteria. These criteria do not identically match the MSCI World Quality Index’s criteria, nor does CCLA’s equity holdings identically match the MSCI World Quality Index.
4 ‘CCLA’s Charlotte Ryland and Joe Hawkes: How to position for the end of the 90-day tariff pause. Focus on quality’, Investment Week, 26 June 2025.
5 The broader MSCI World Index had a 1.62% dividend yield, as of 30 September 2025.
Glossary
Please refer to the glossary for explanations of terms used in this communication.
If you would like the information in an alternative format or have any queries, please call us on 0800 022 3505 or email us at clientservices@ccla.co.uk